Data
“The concept of the elements has an aura of serenity that is hard to resist—a promise that hints at the true core of all matter.”
—Bunpei Yorifuji
Introduction
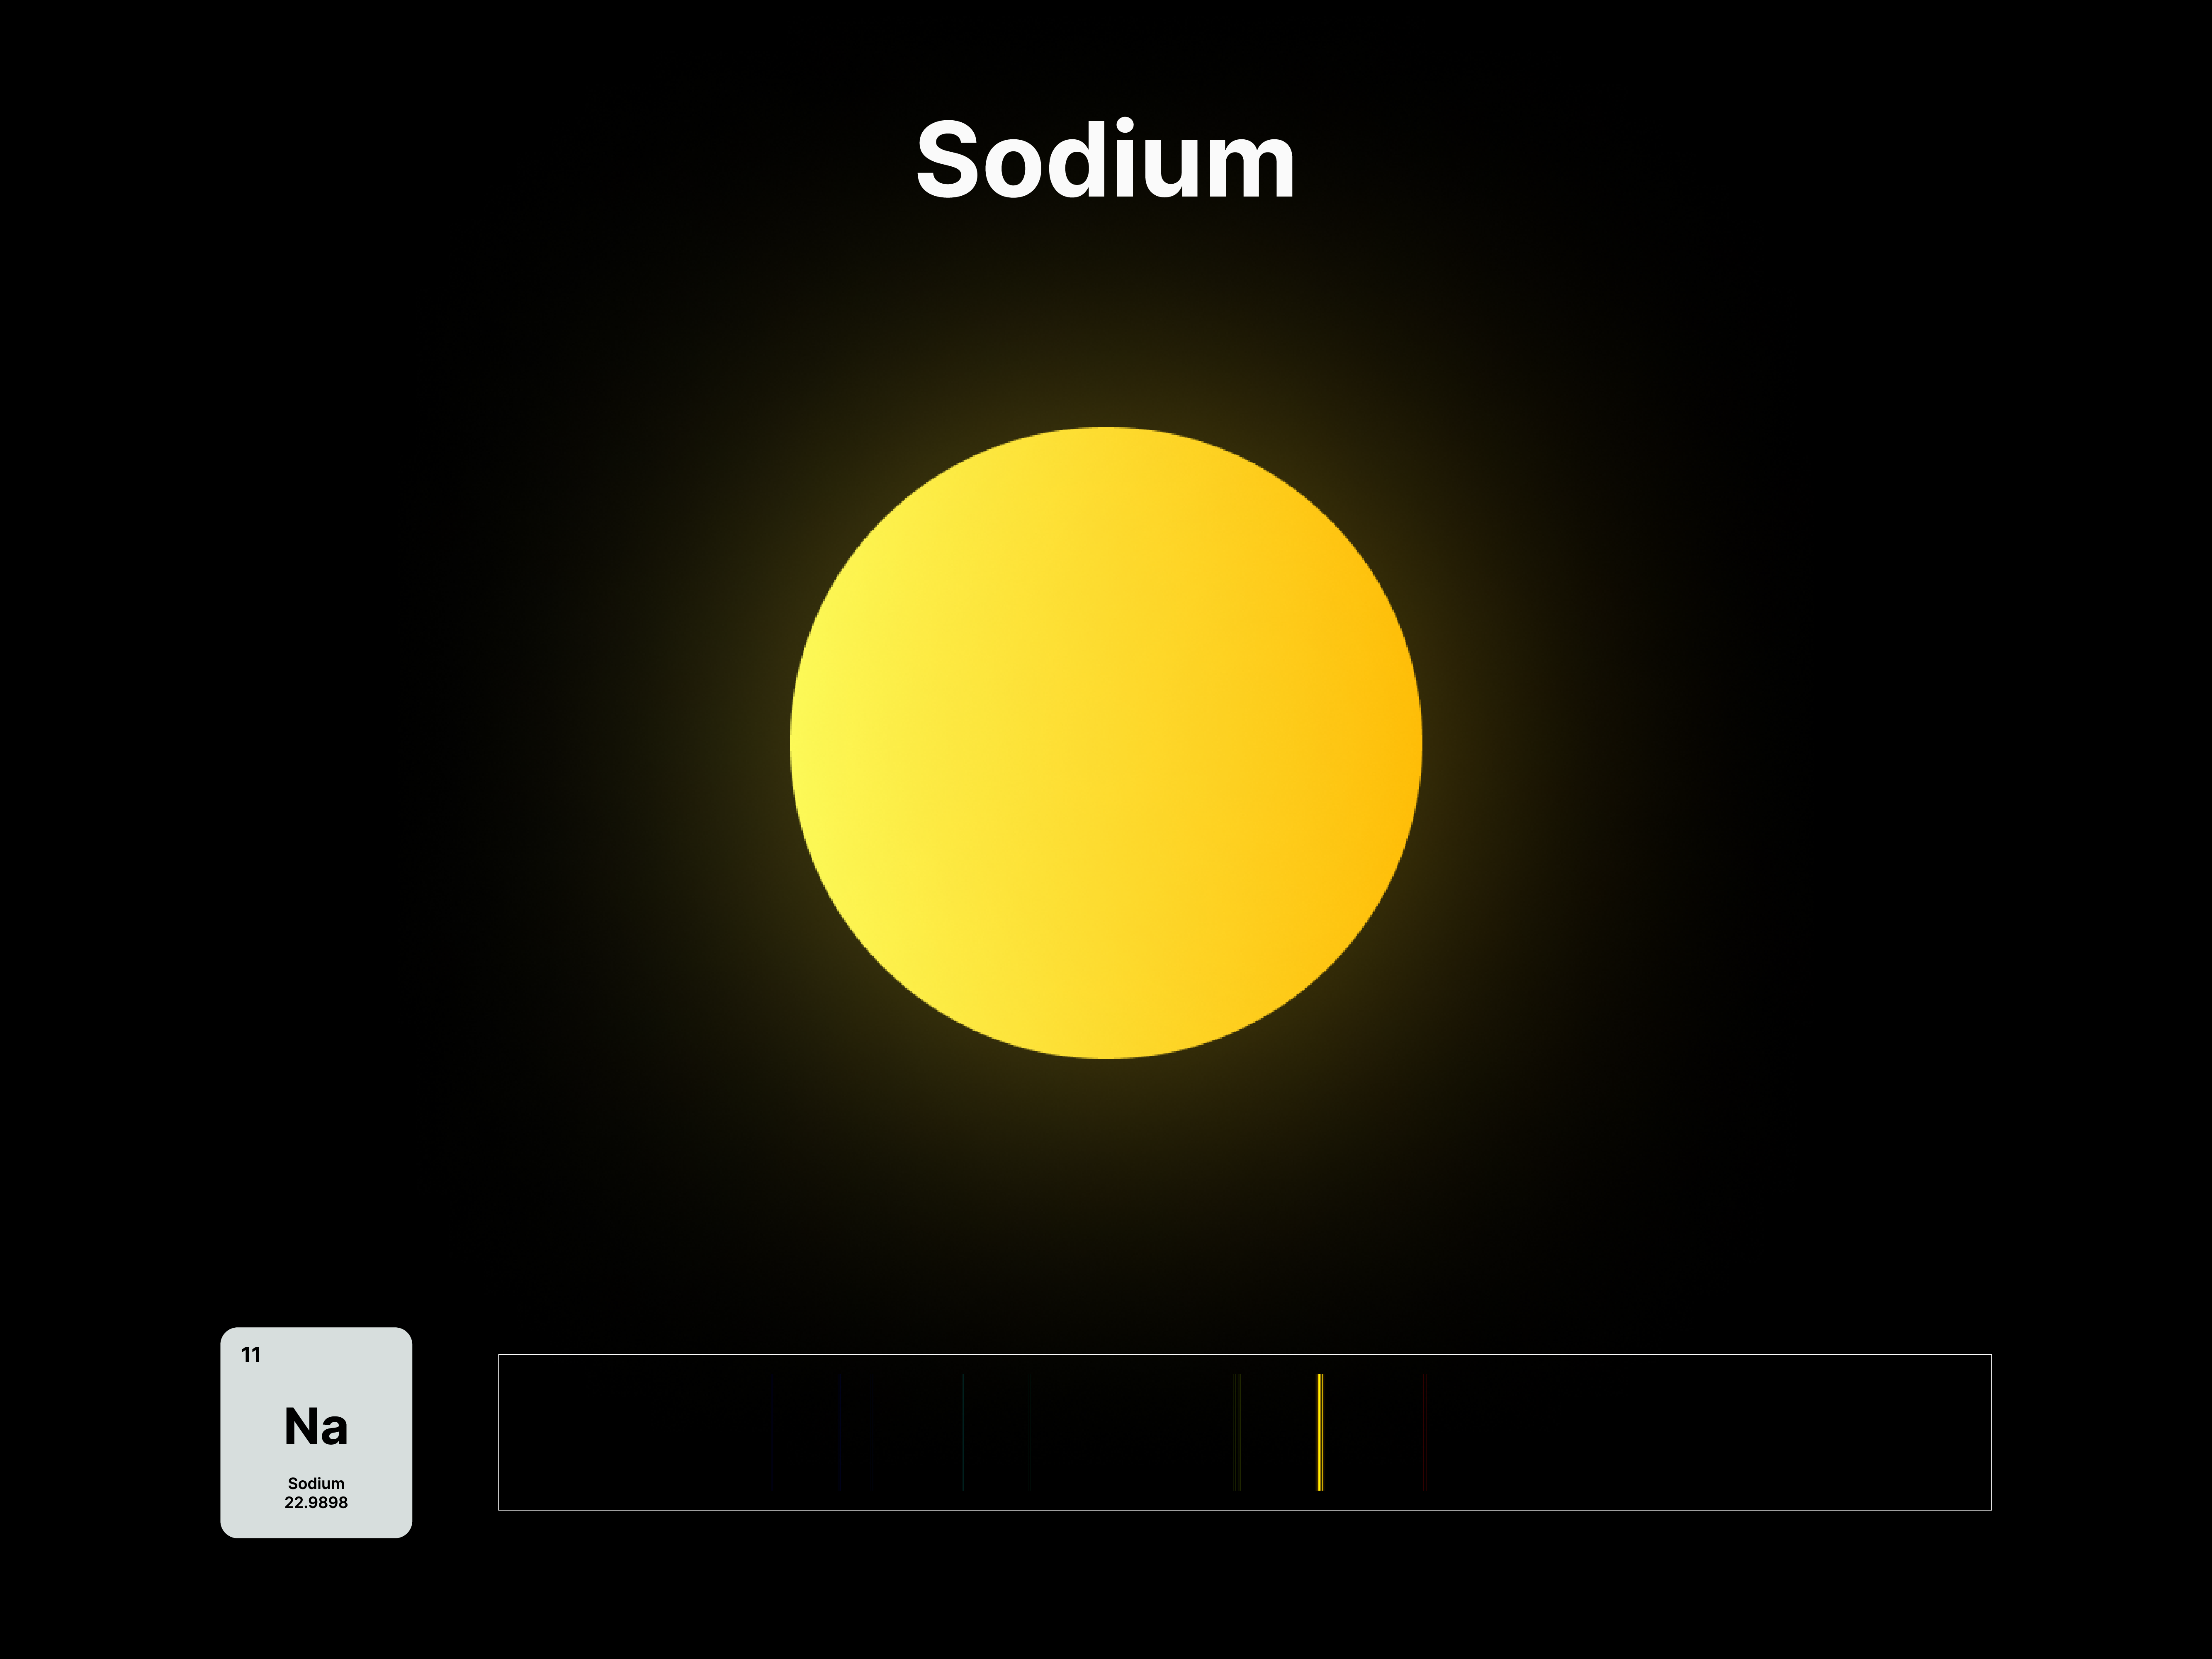
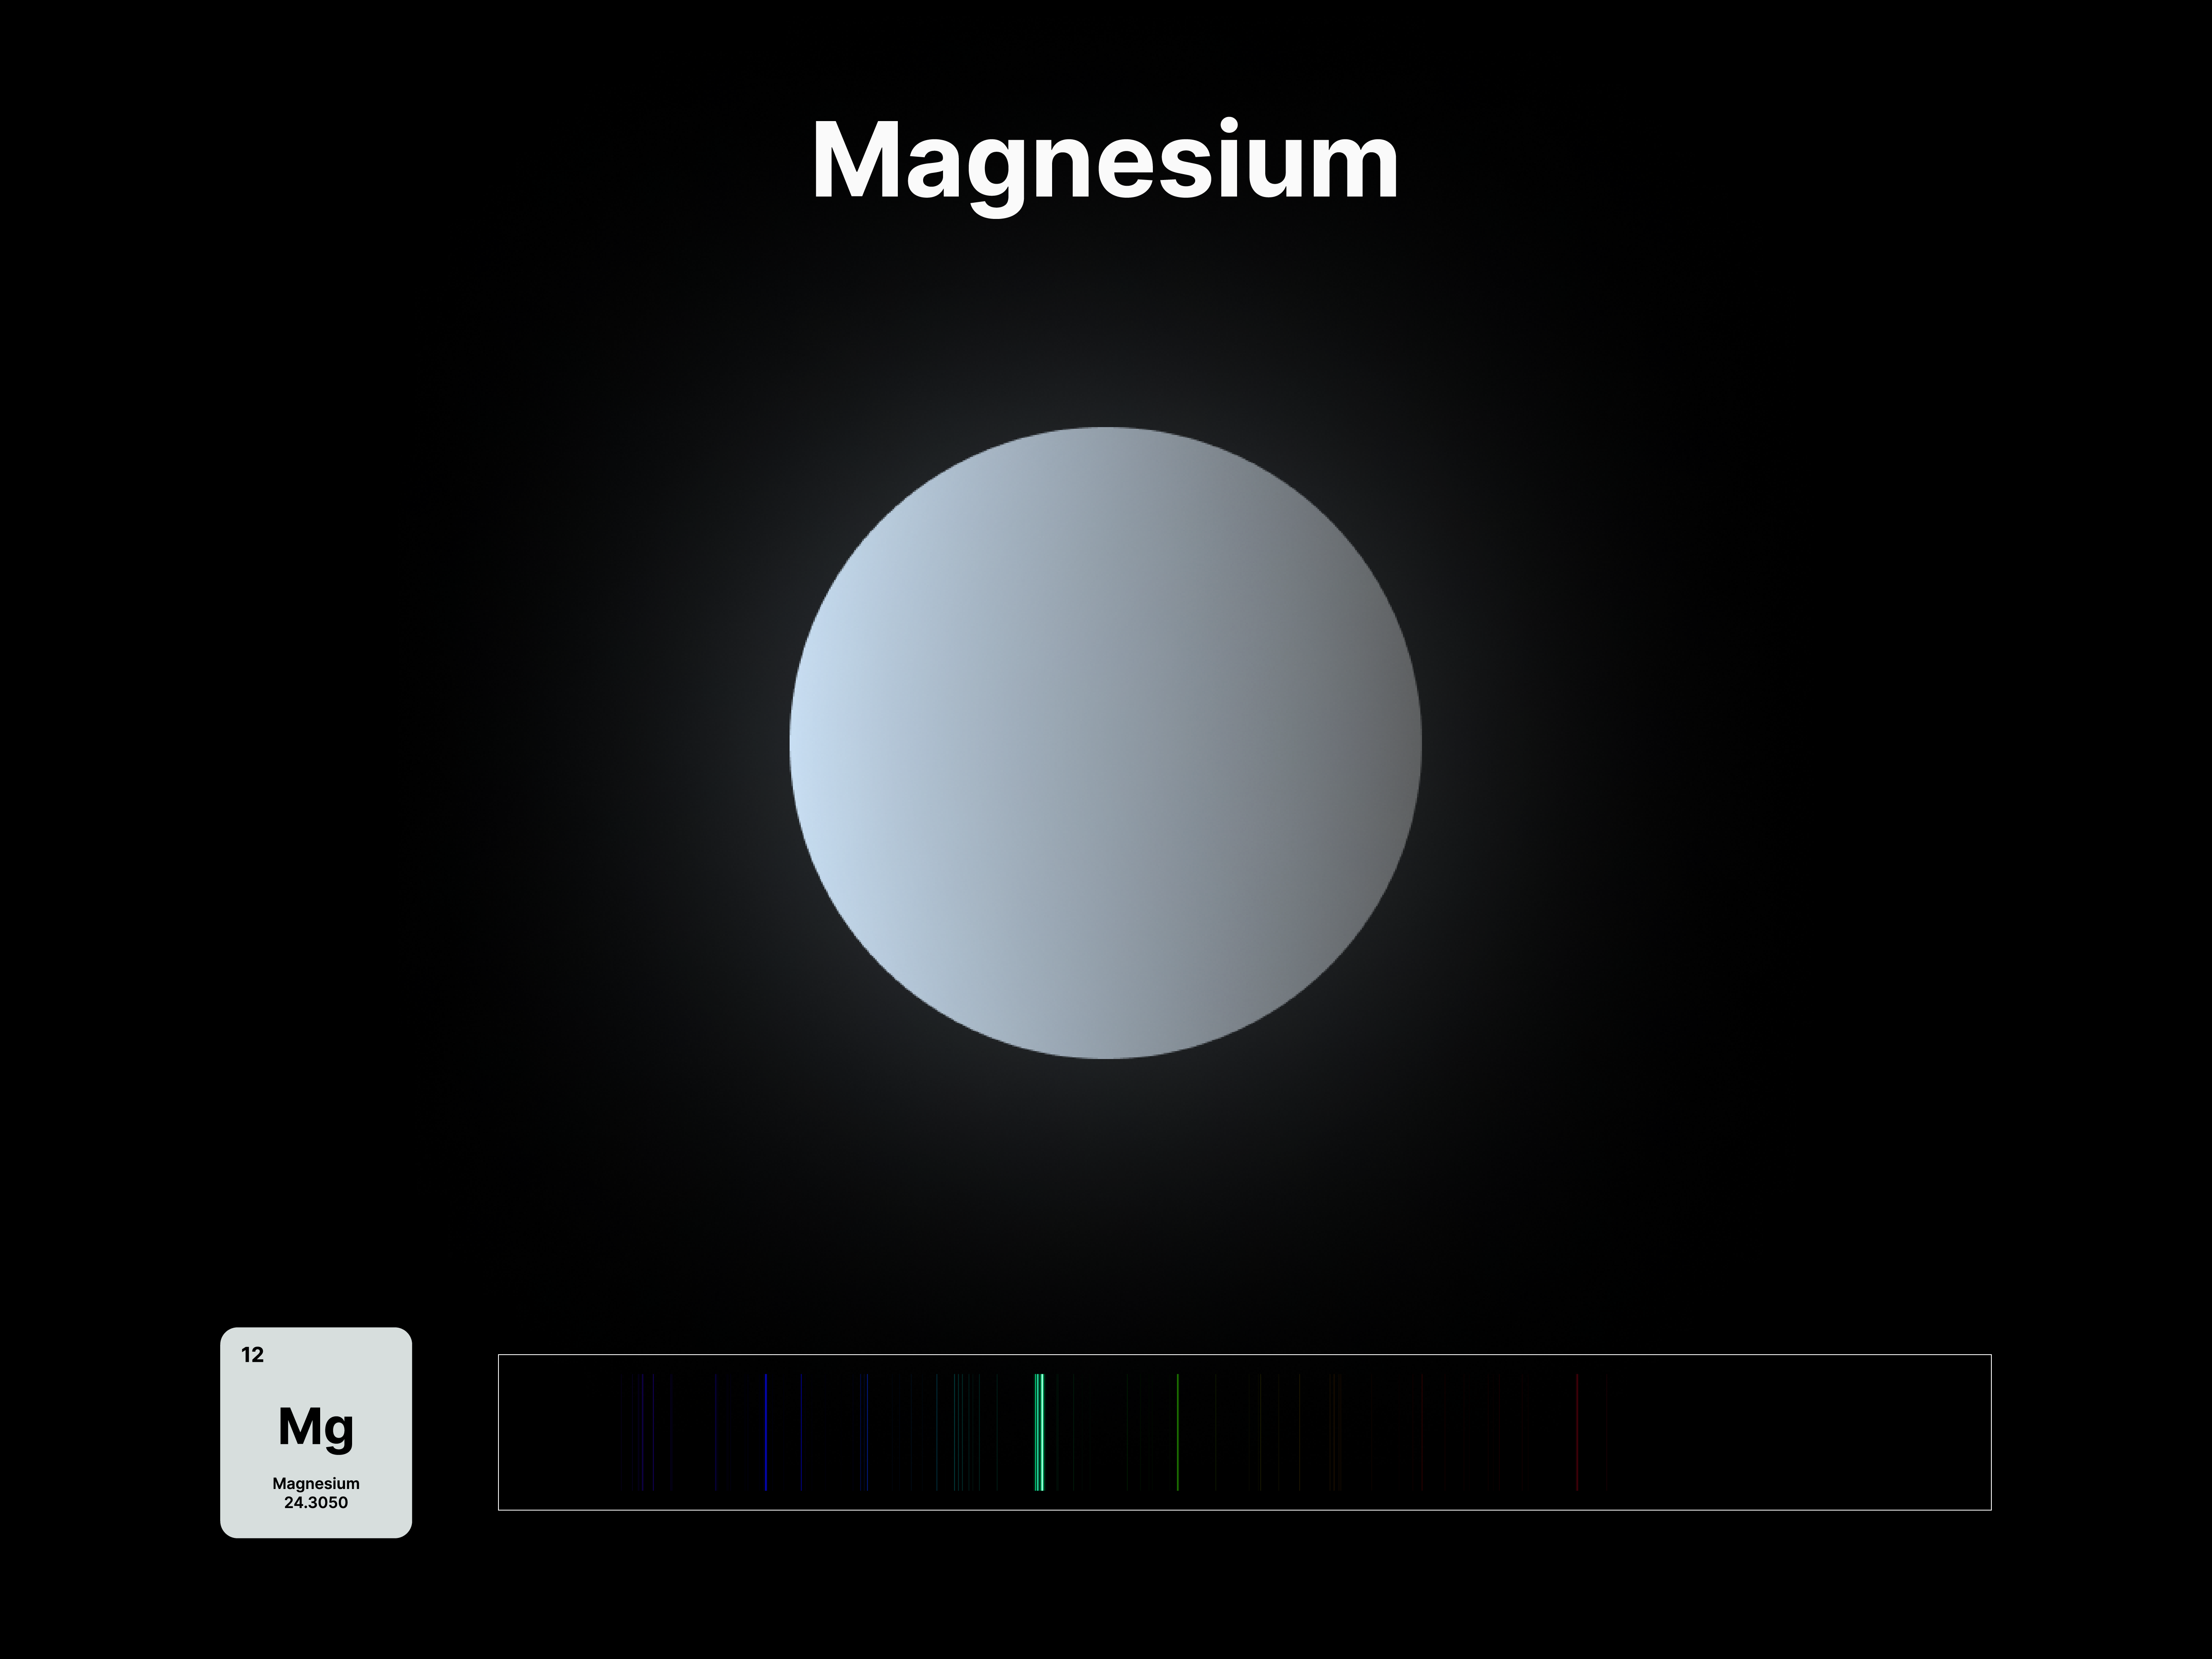
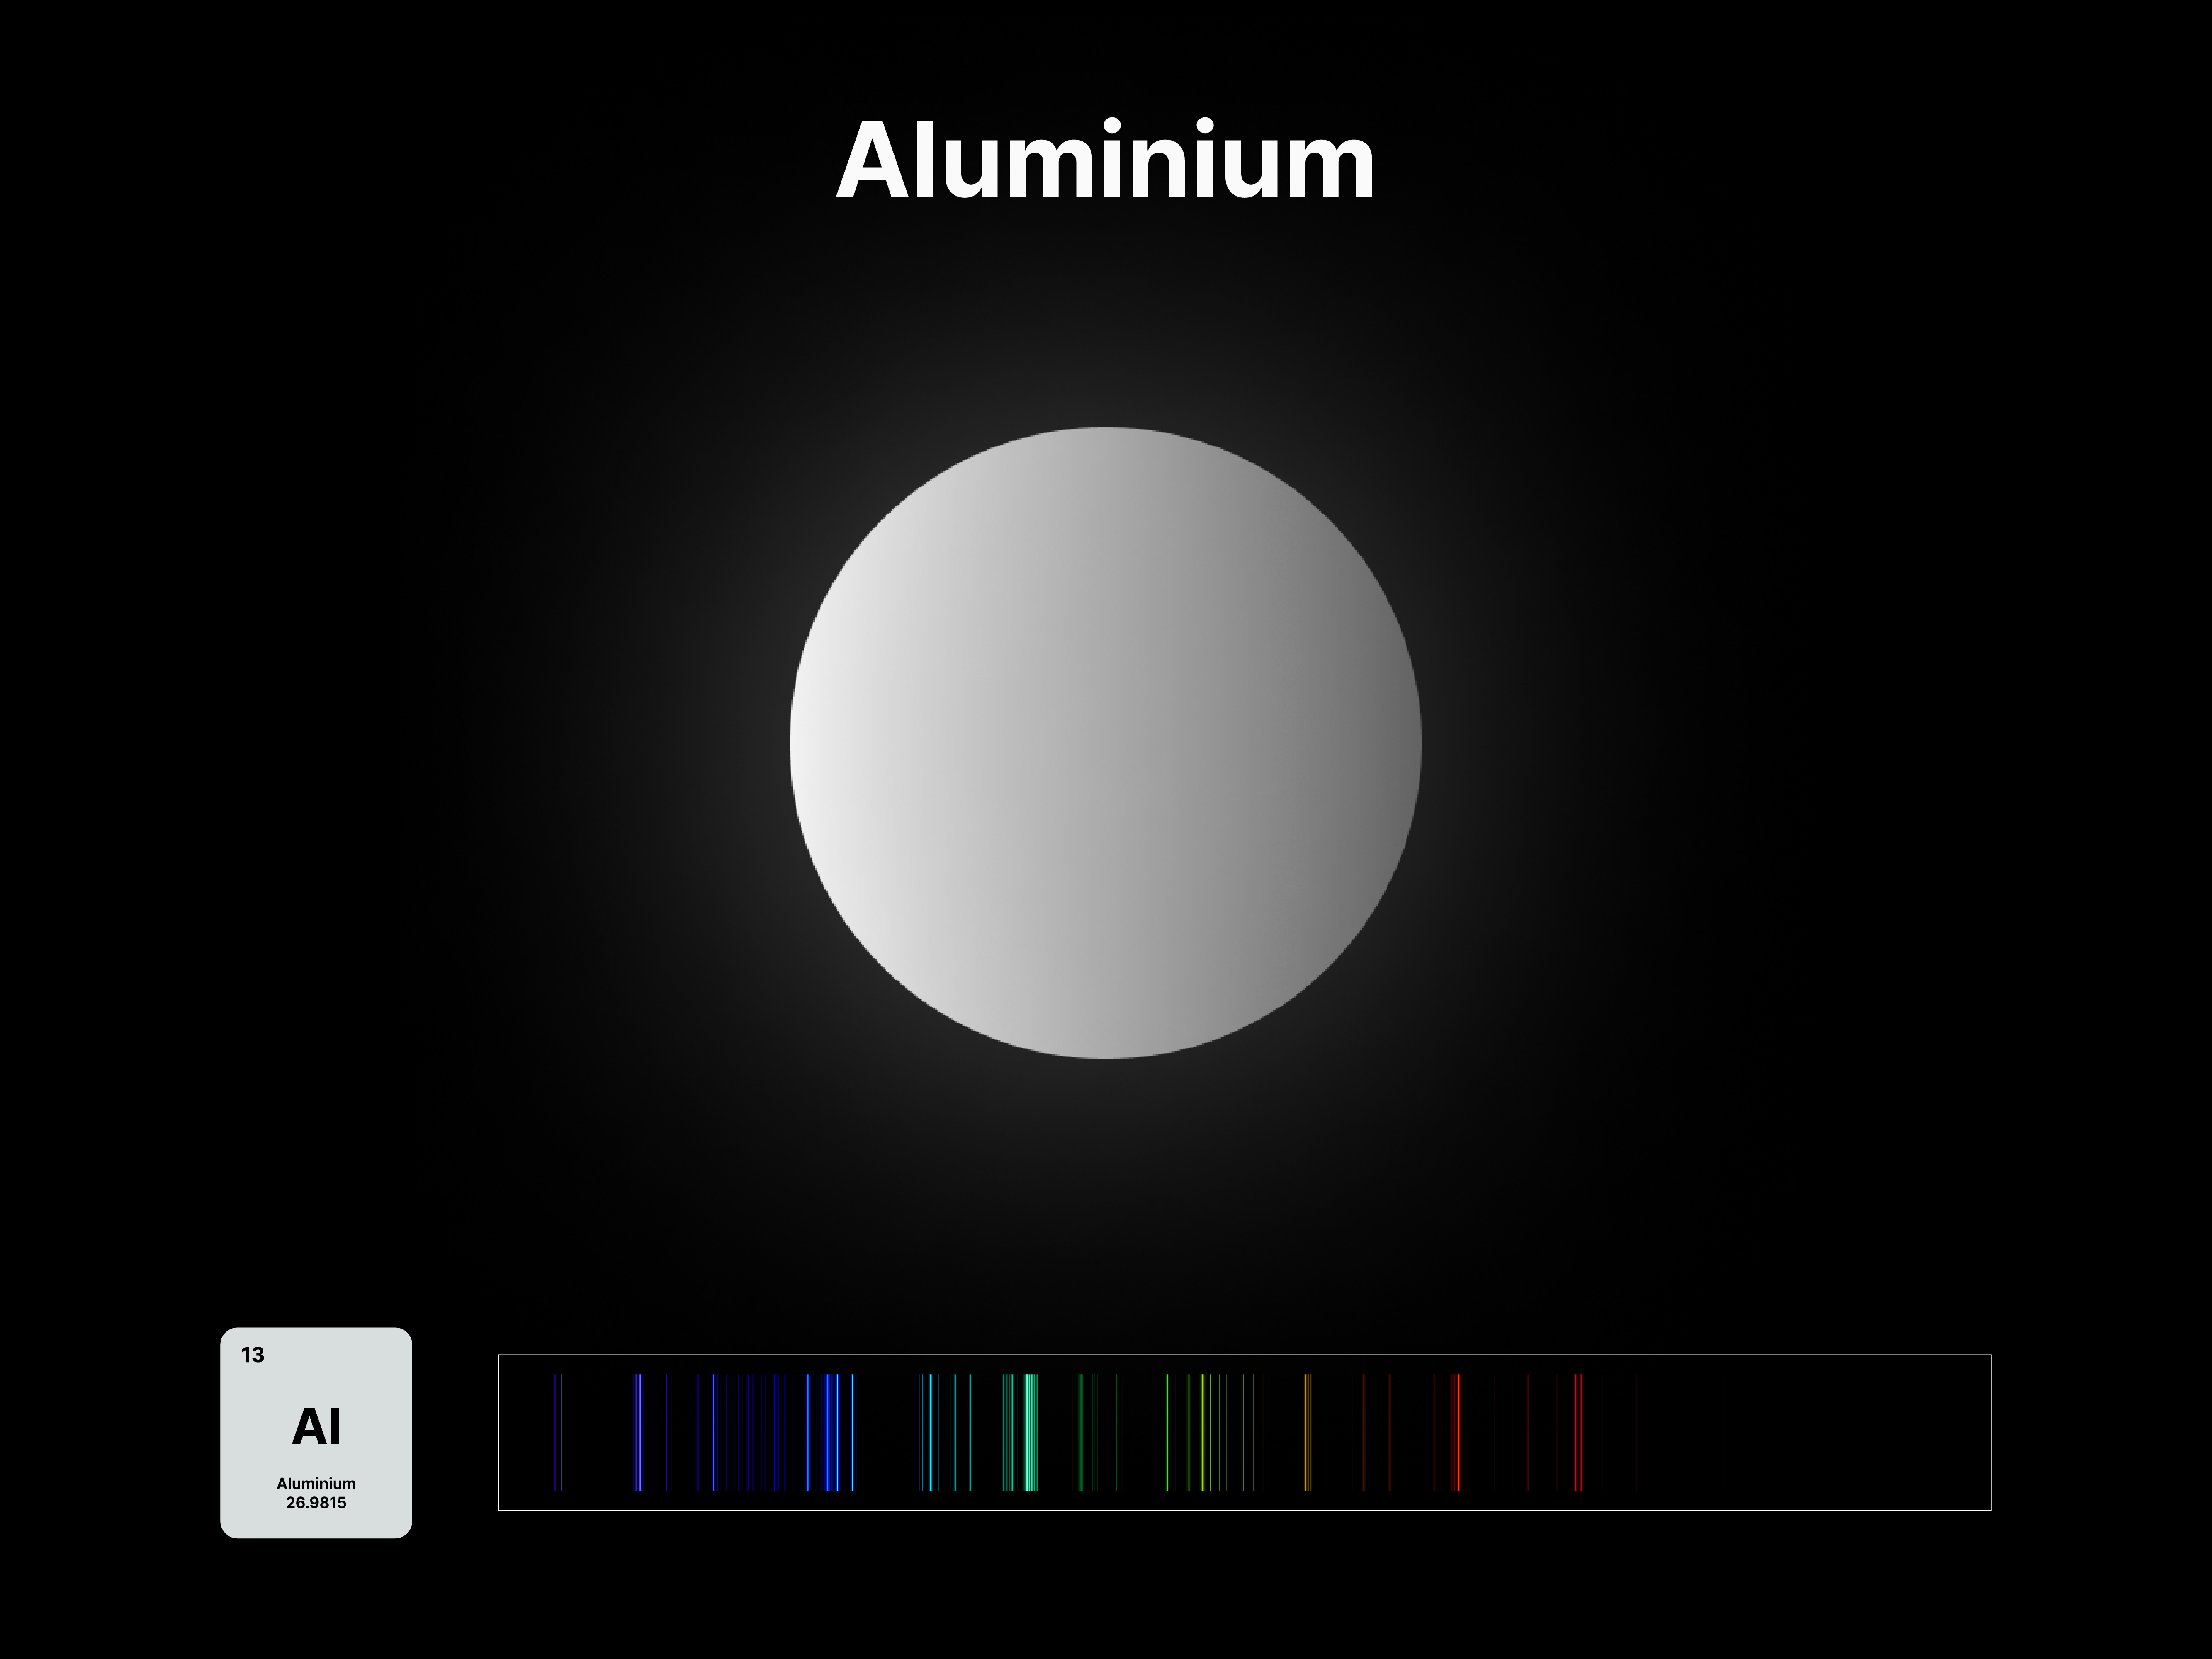
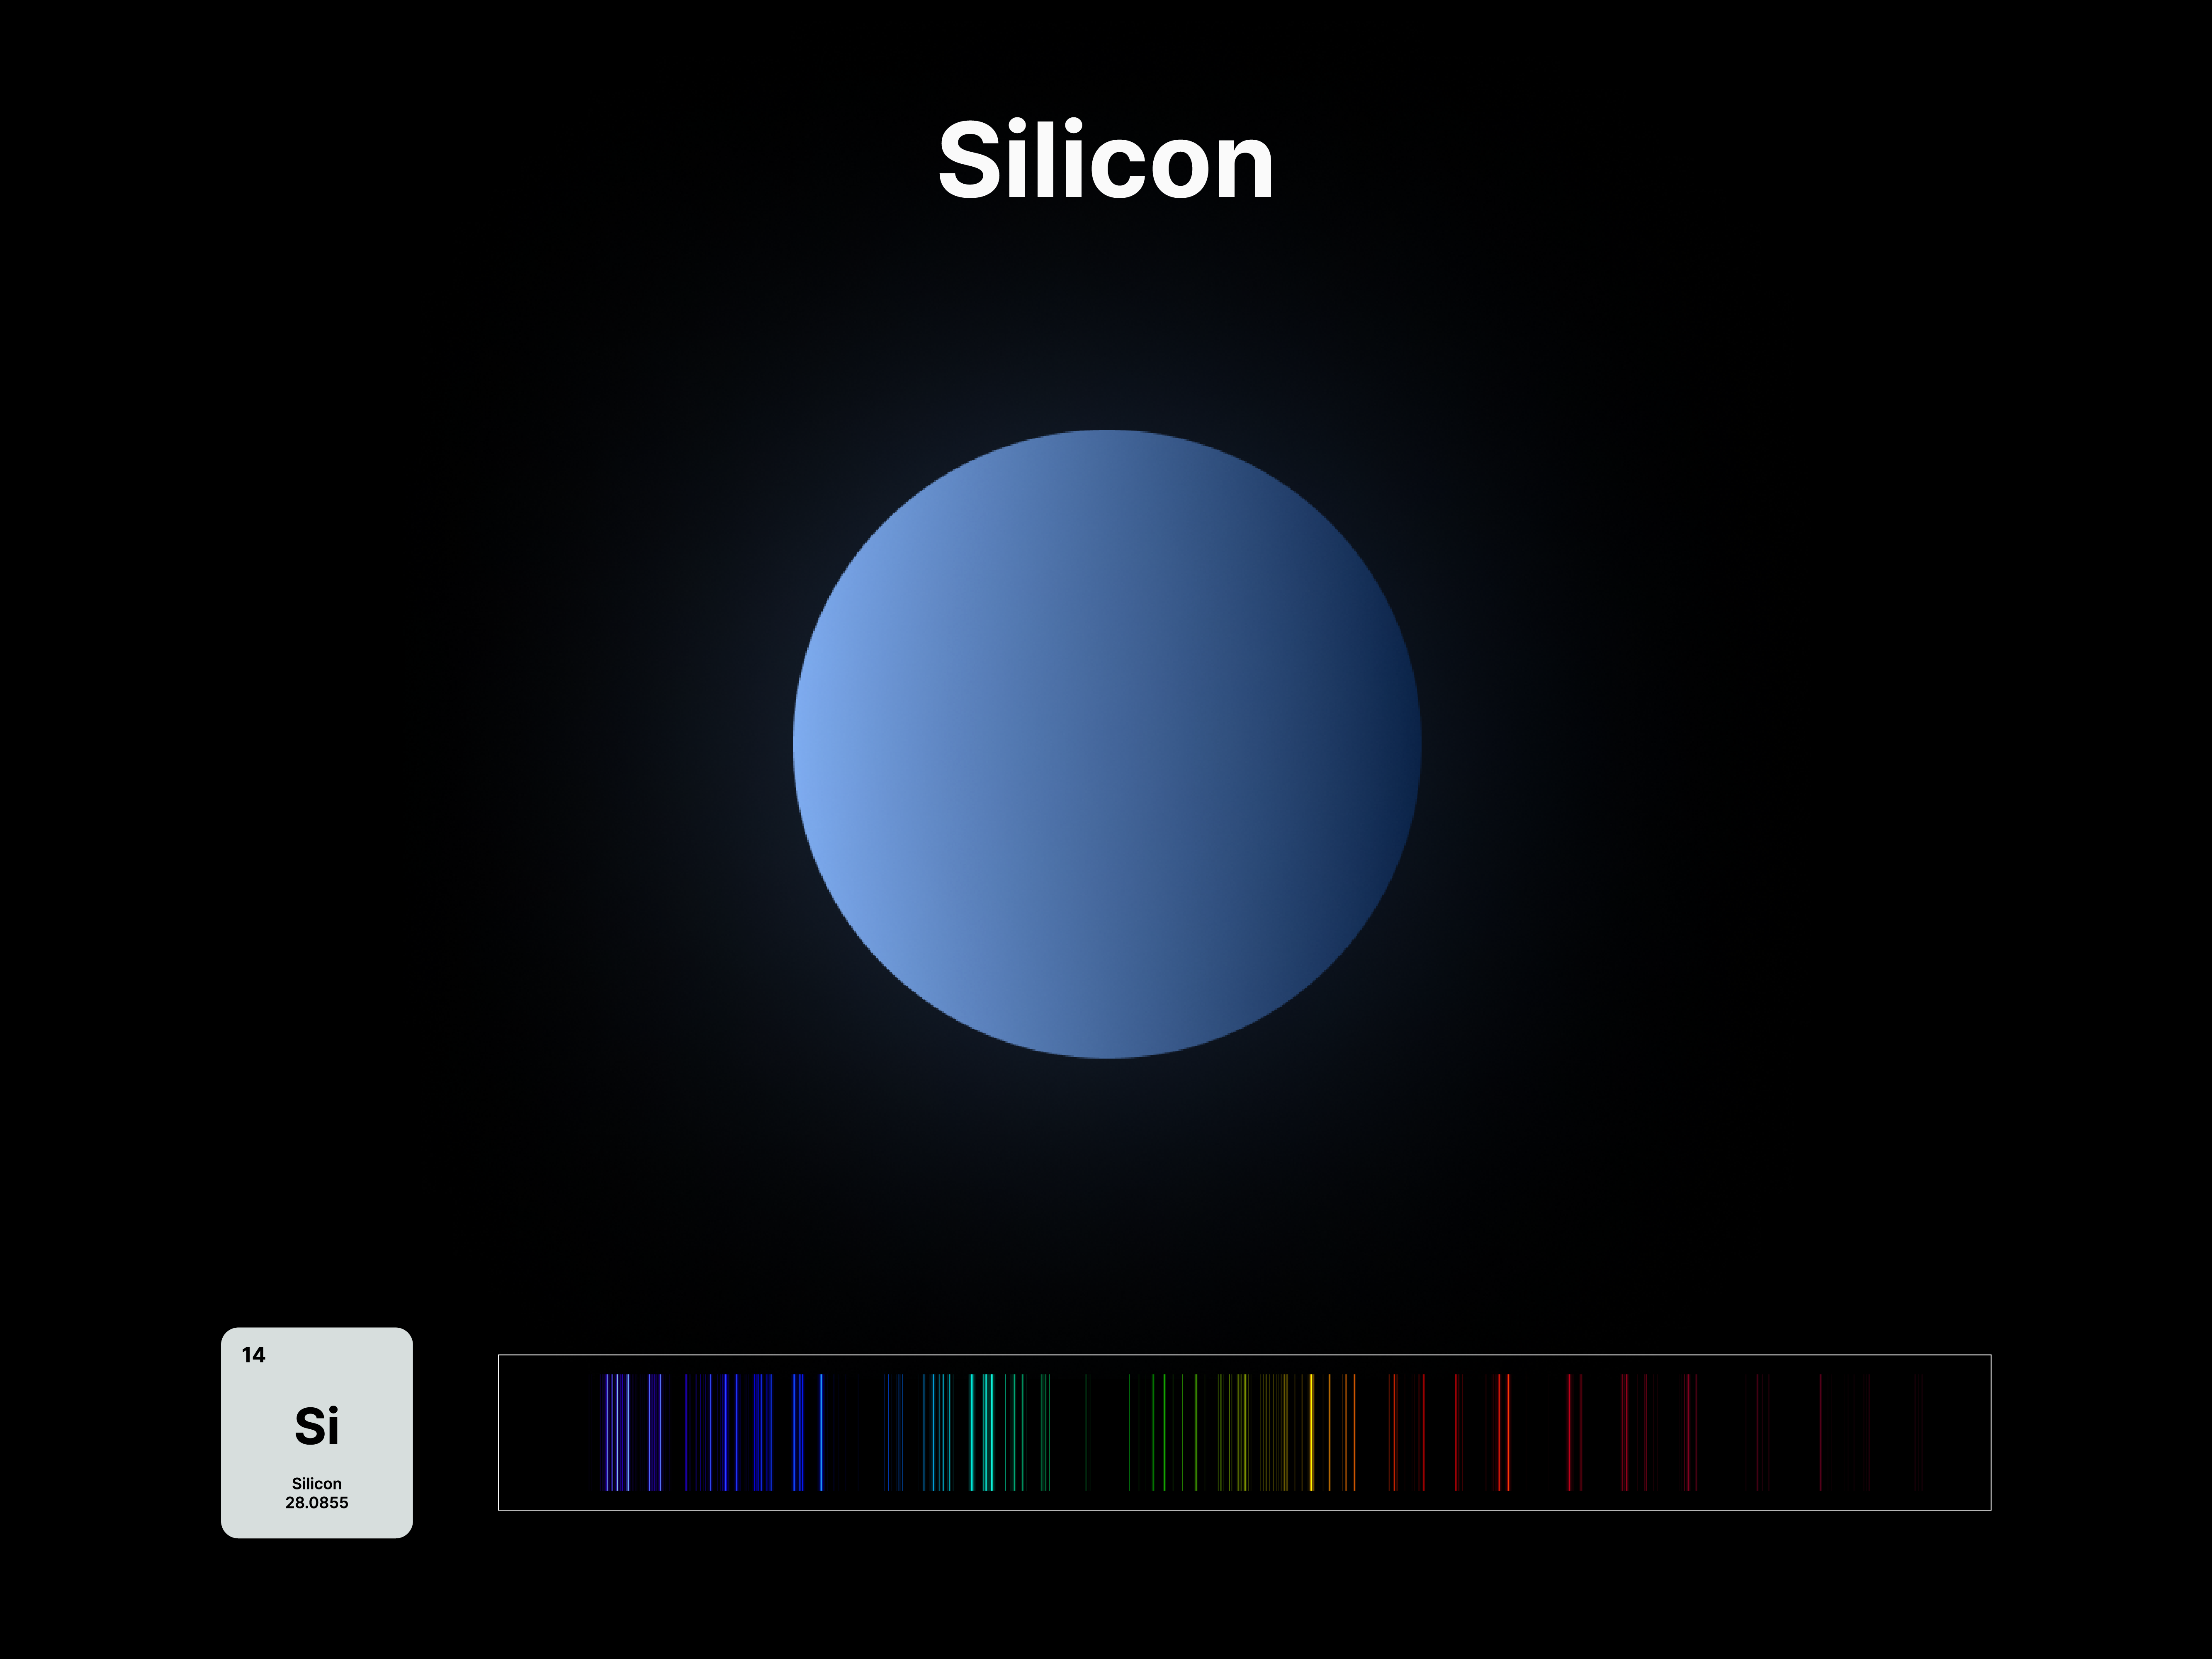
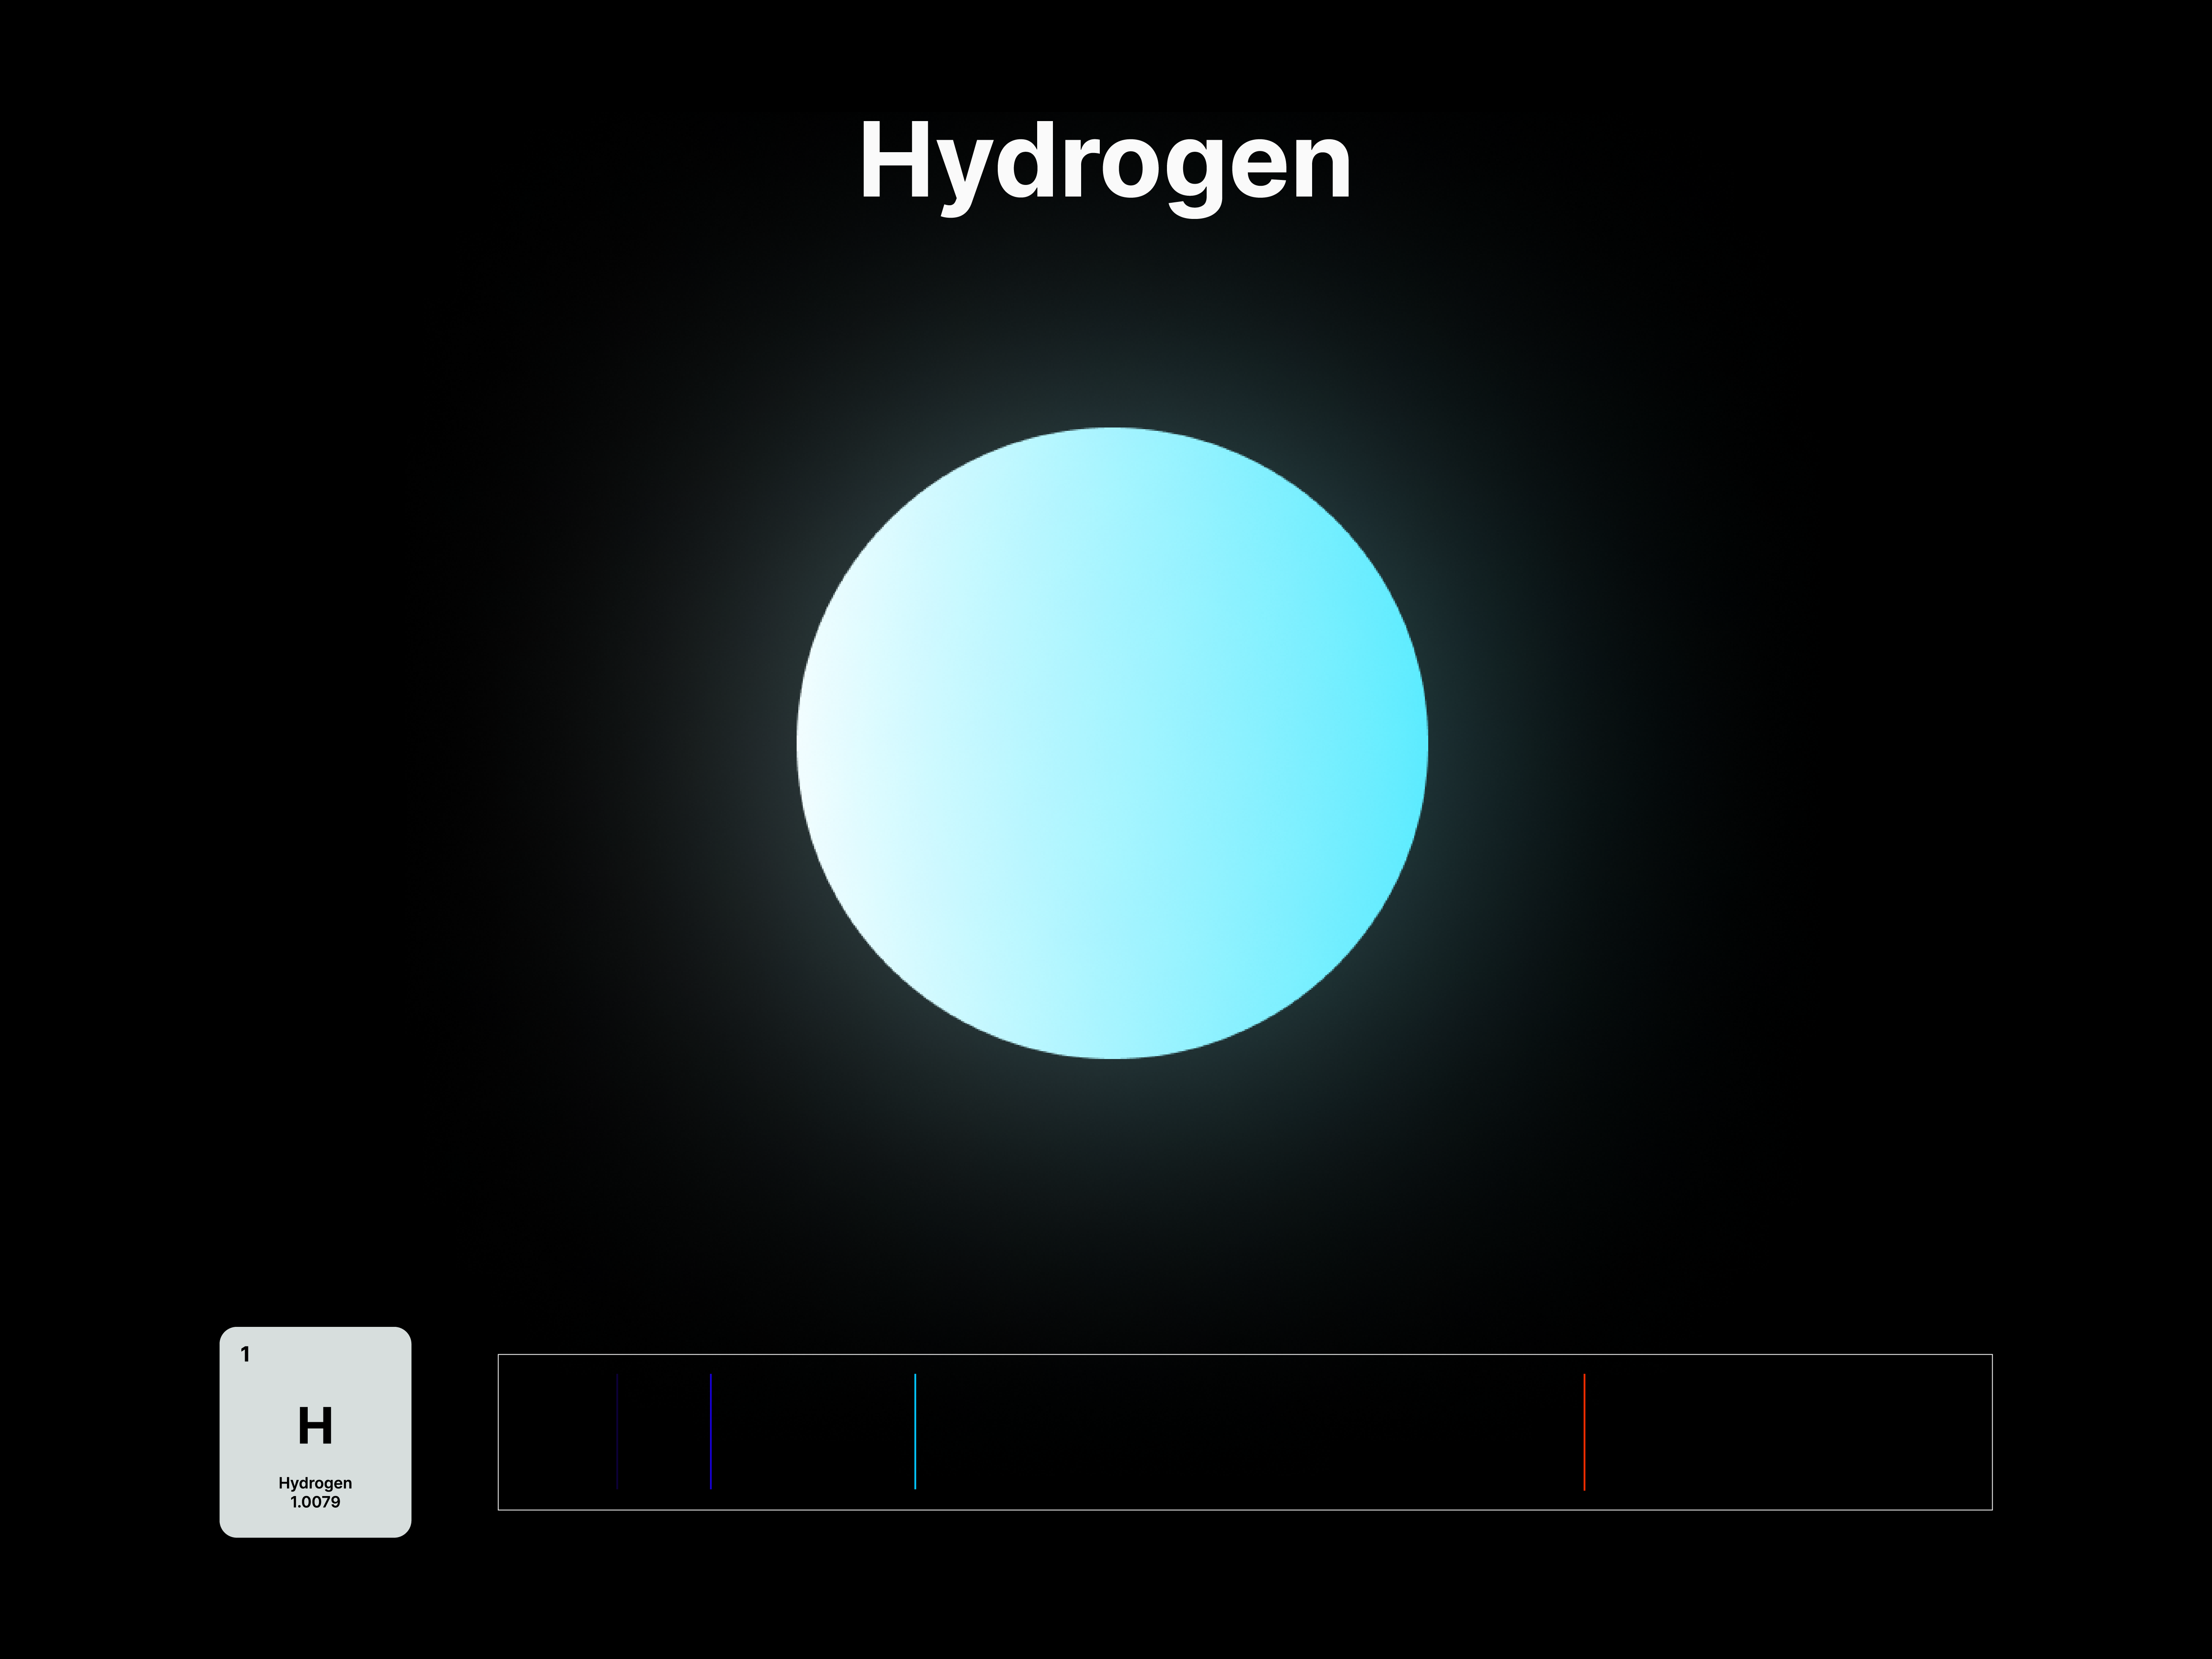
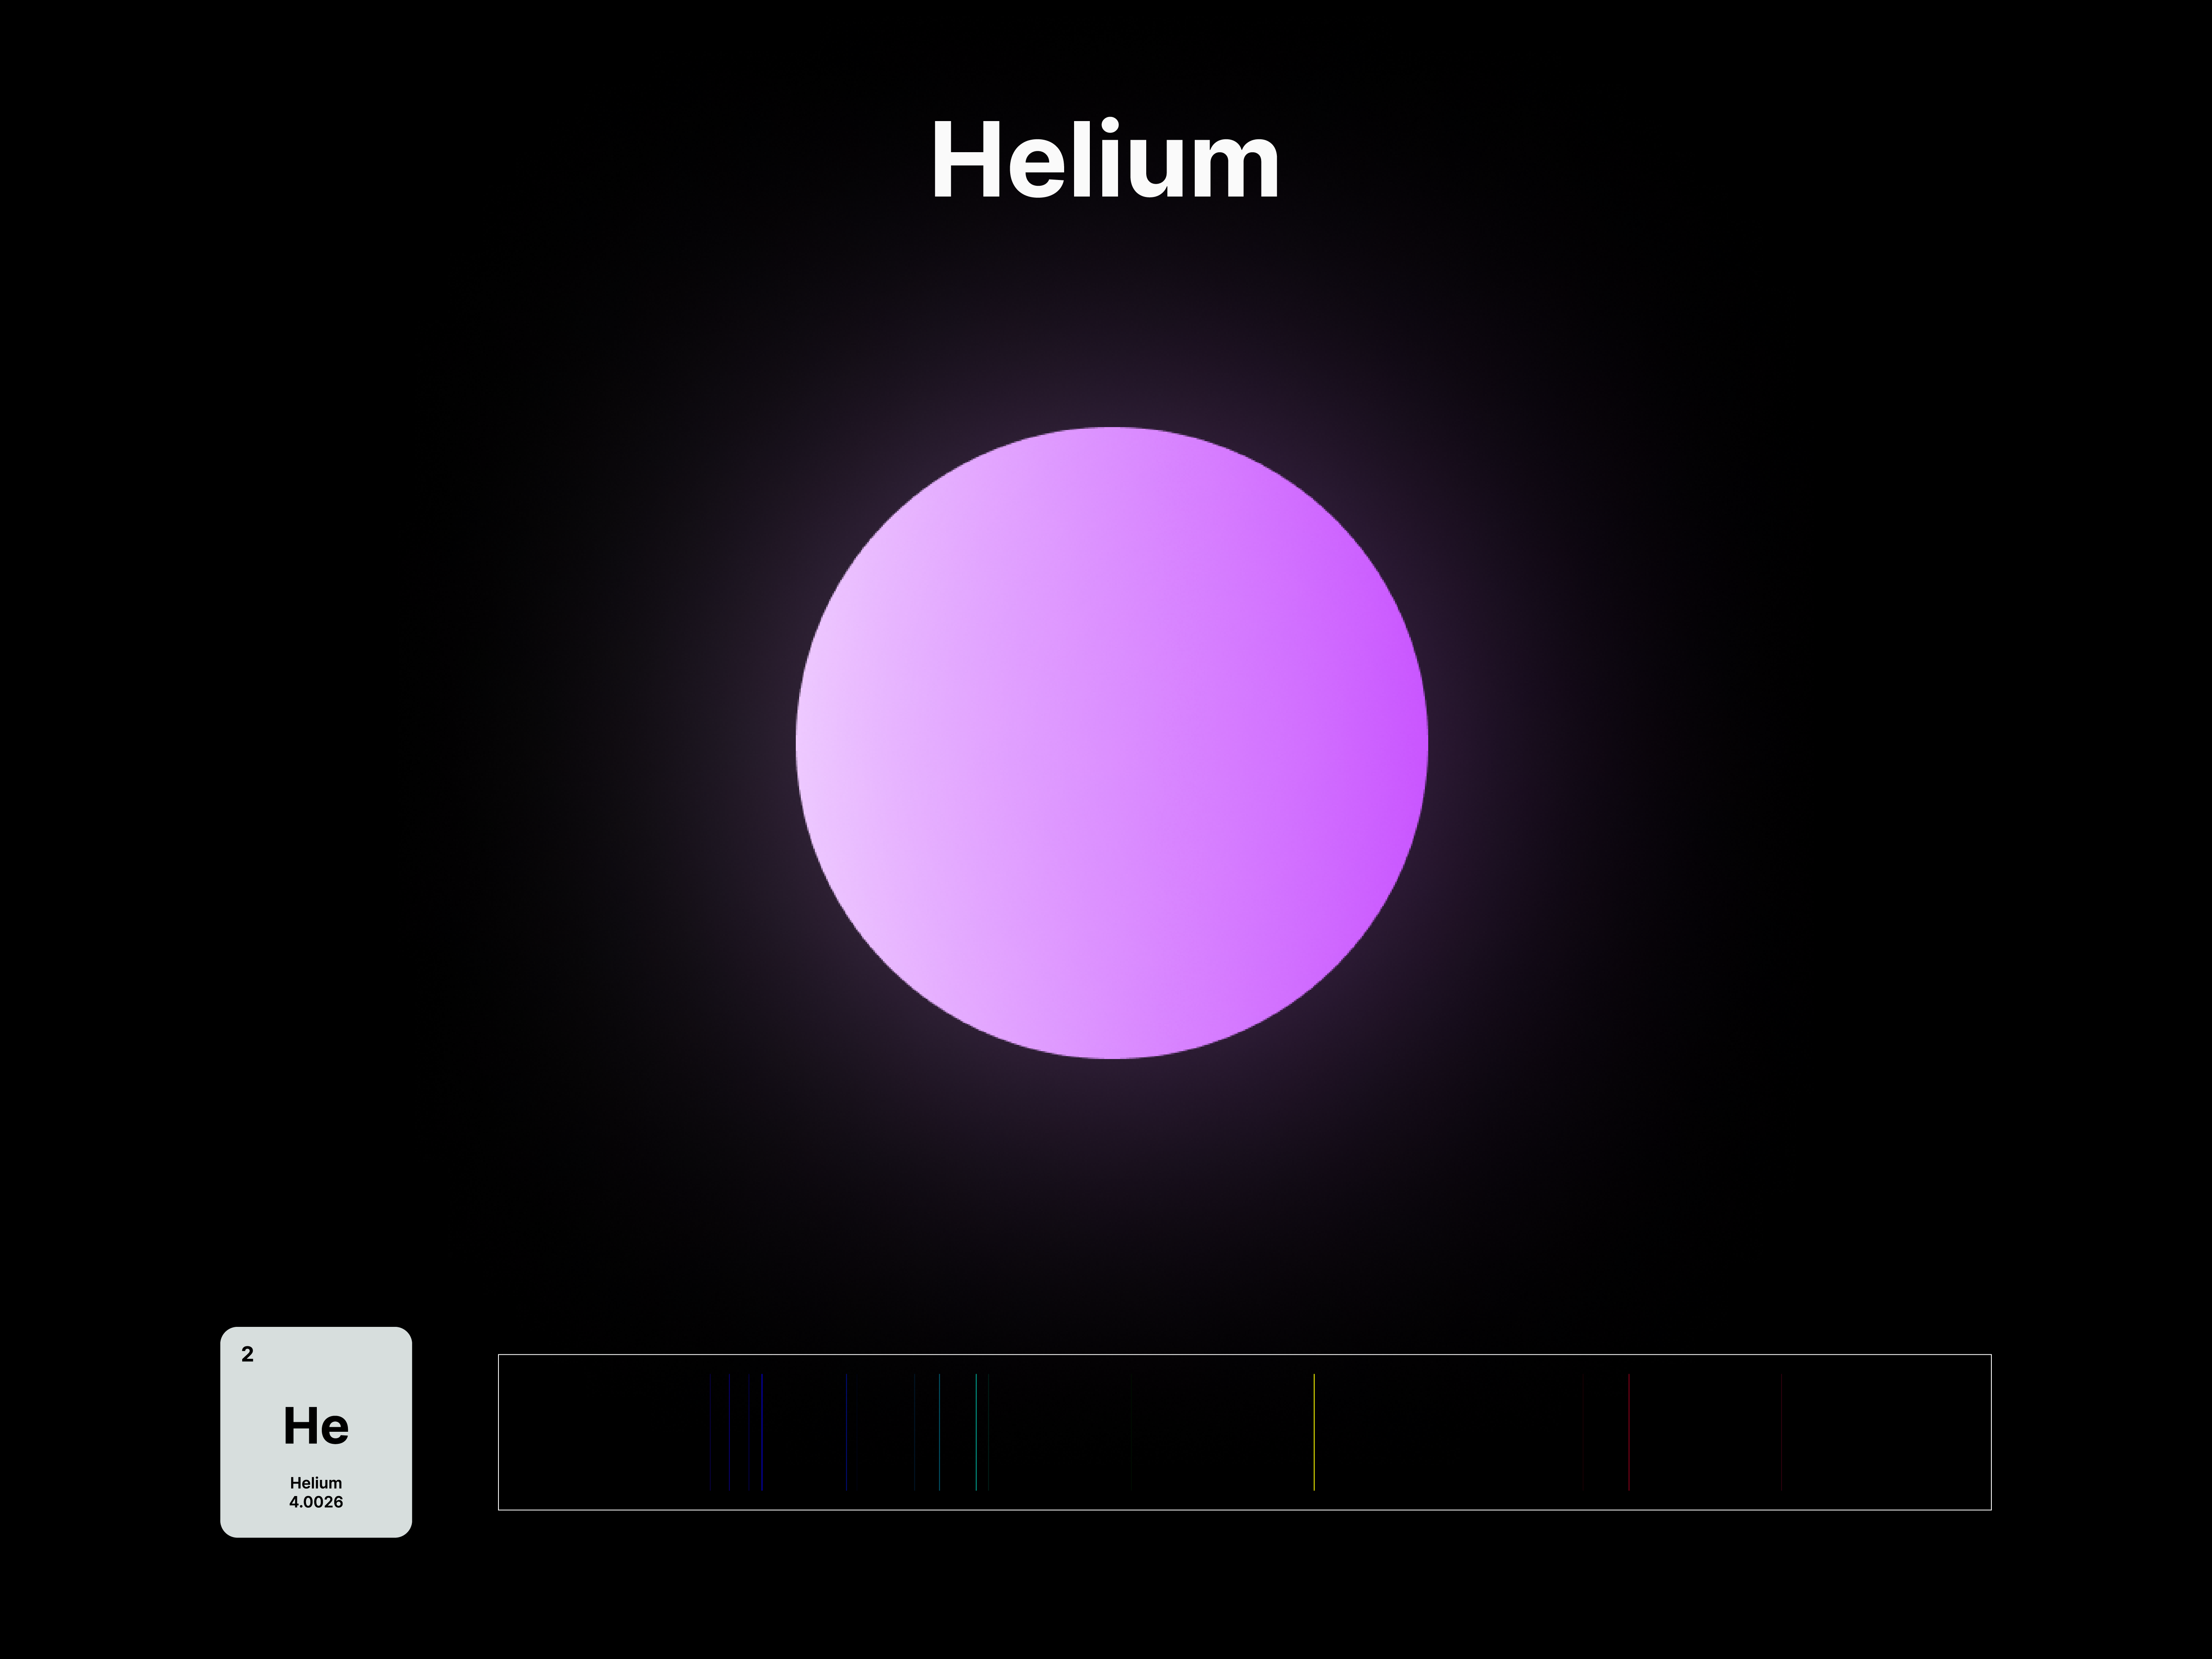
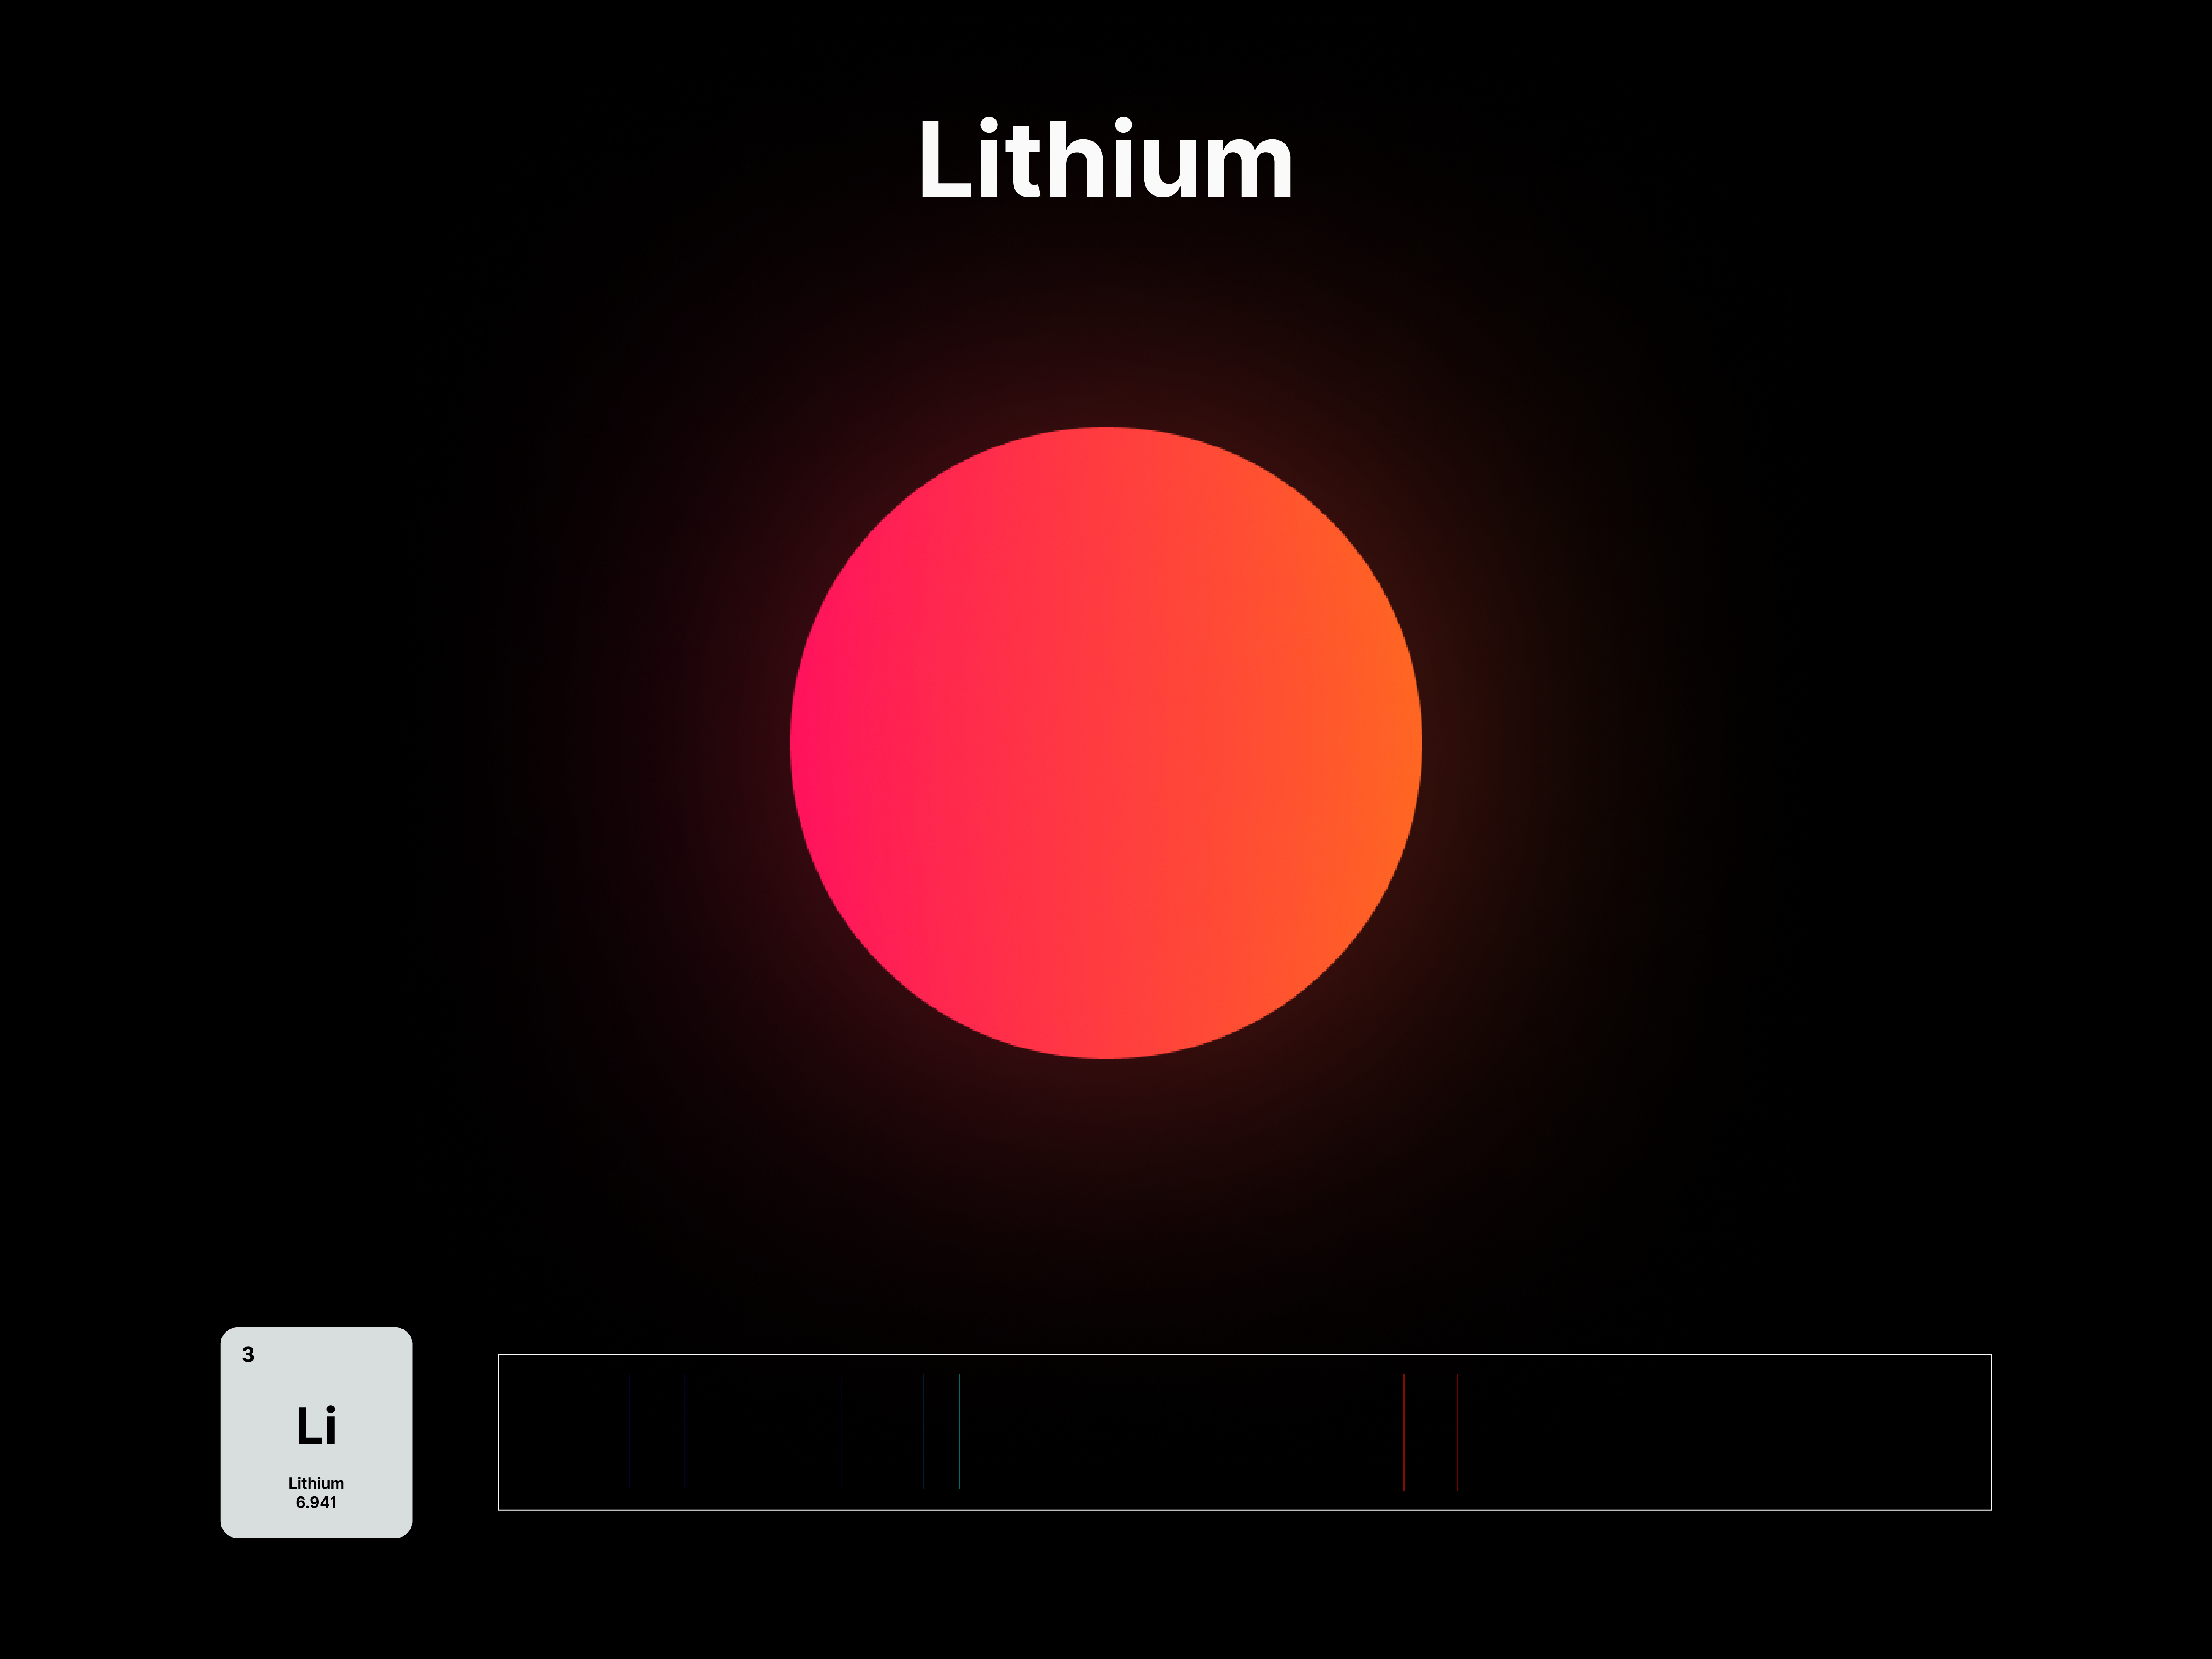
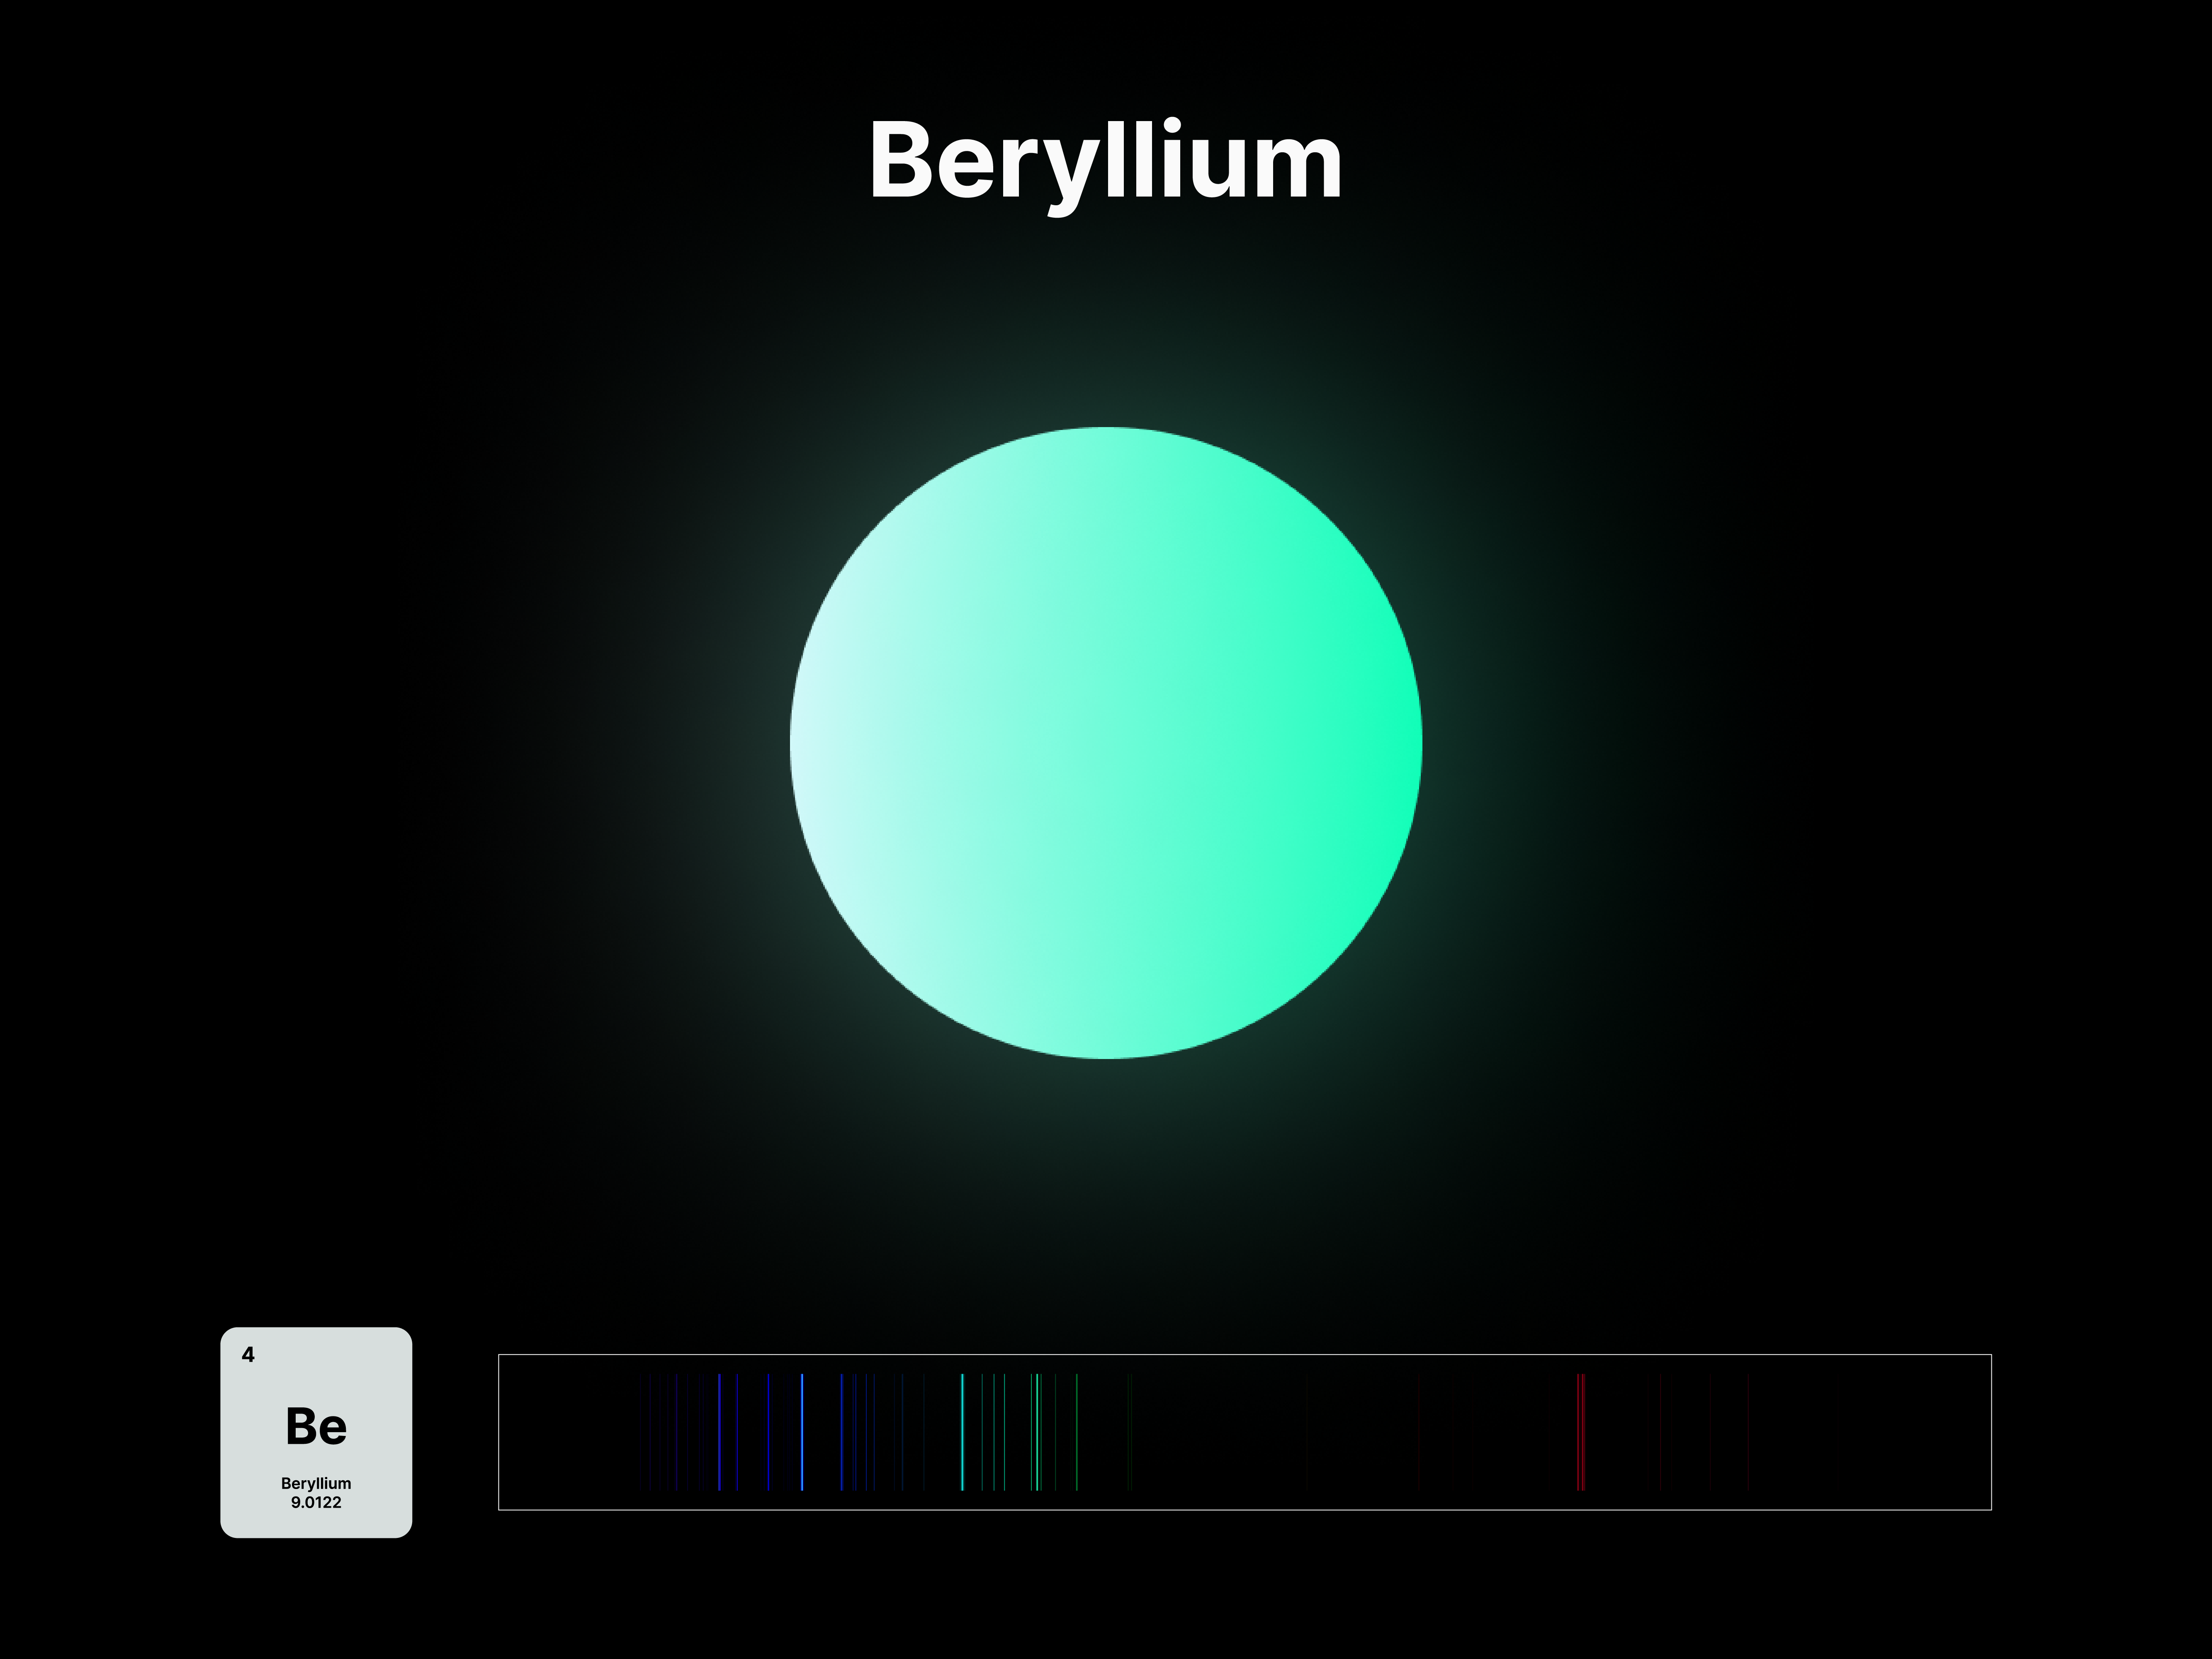
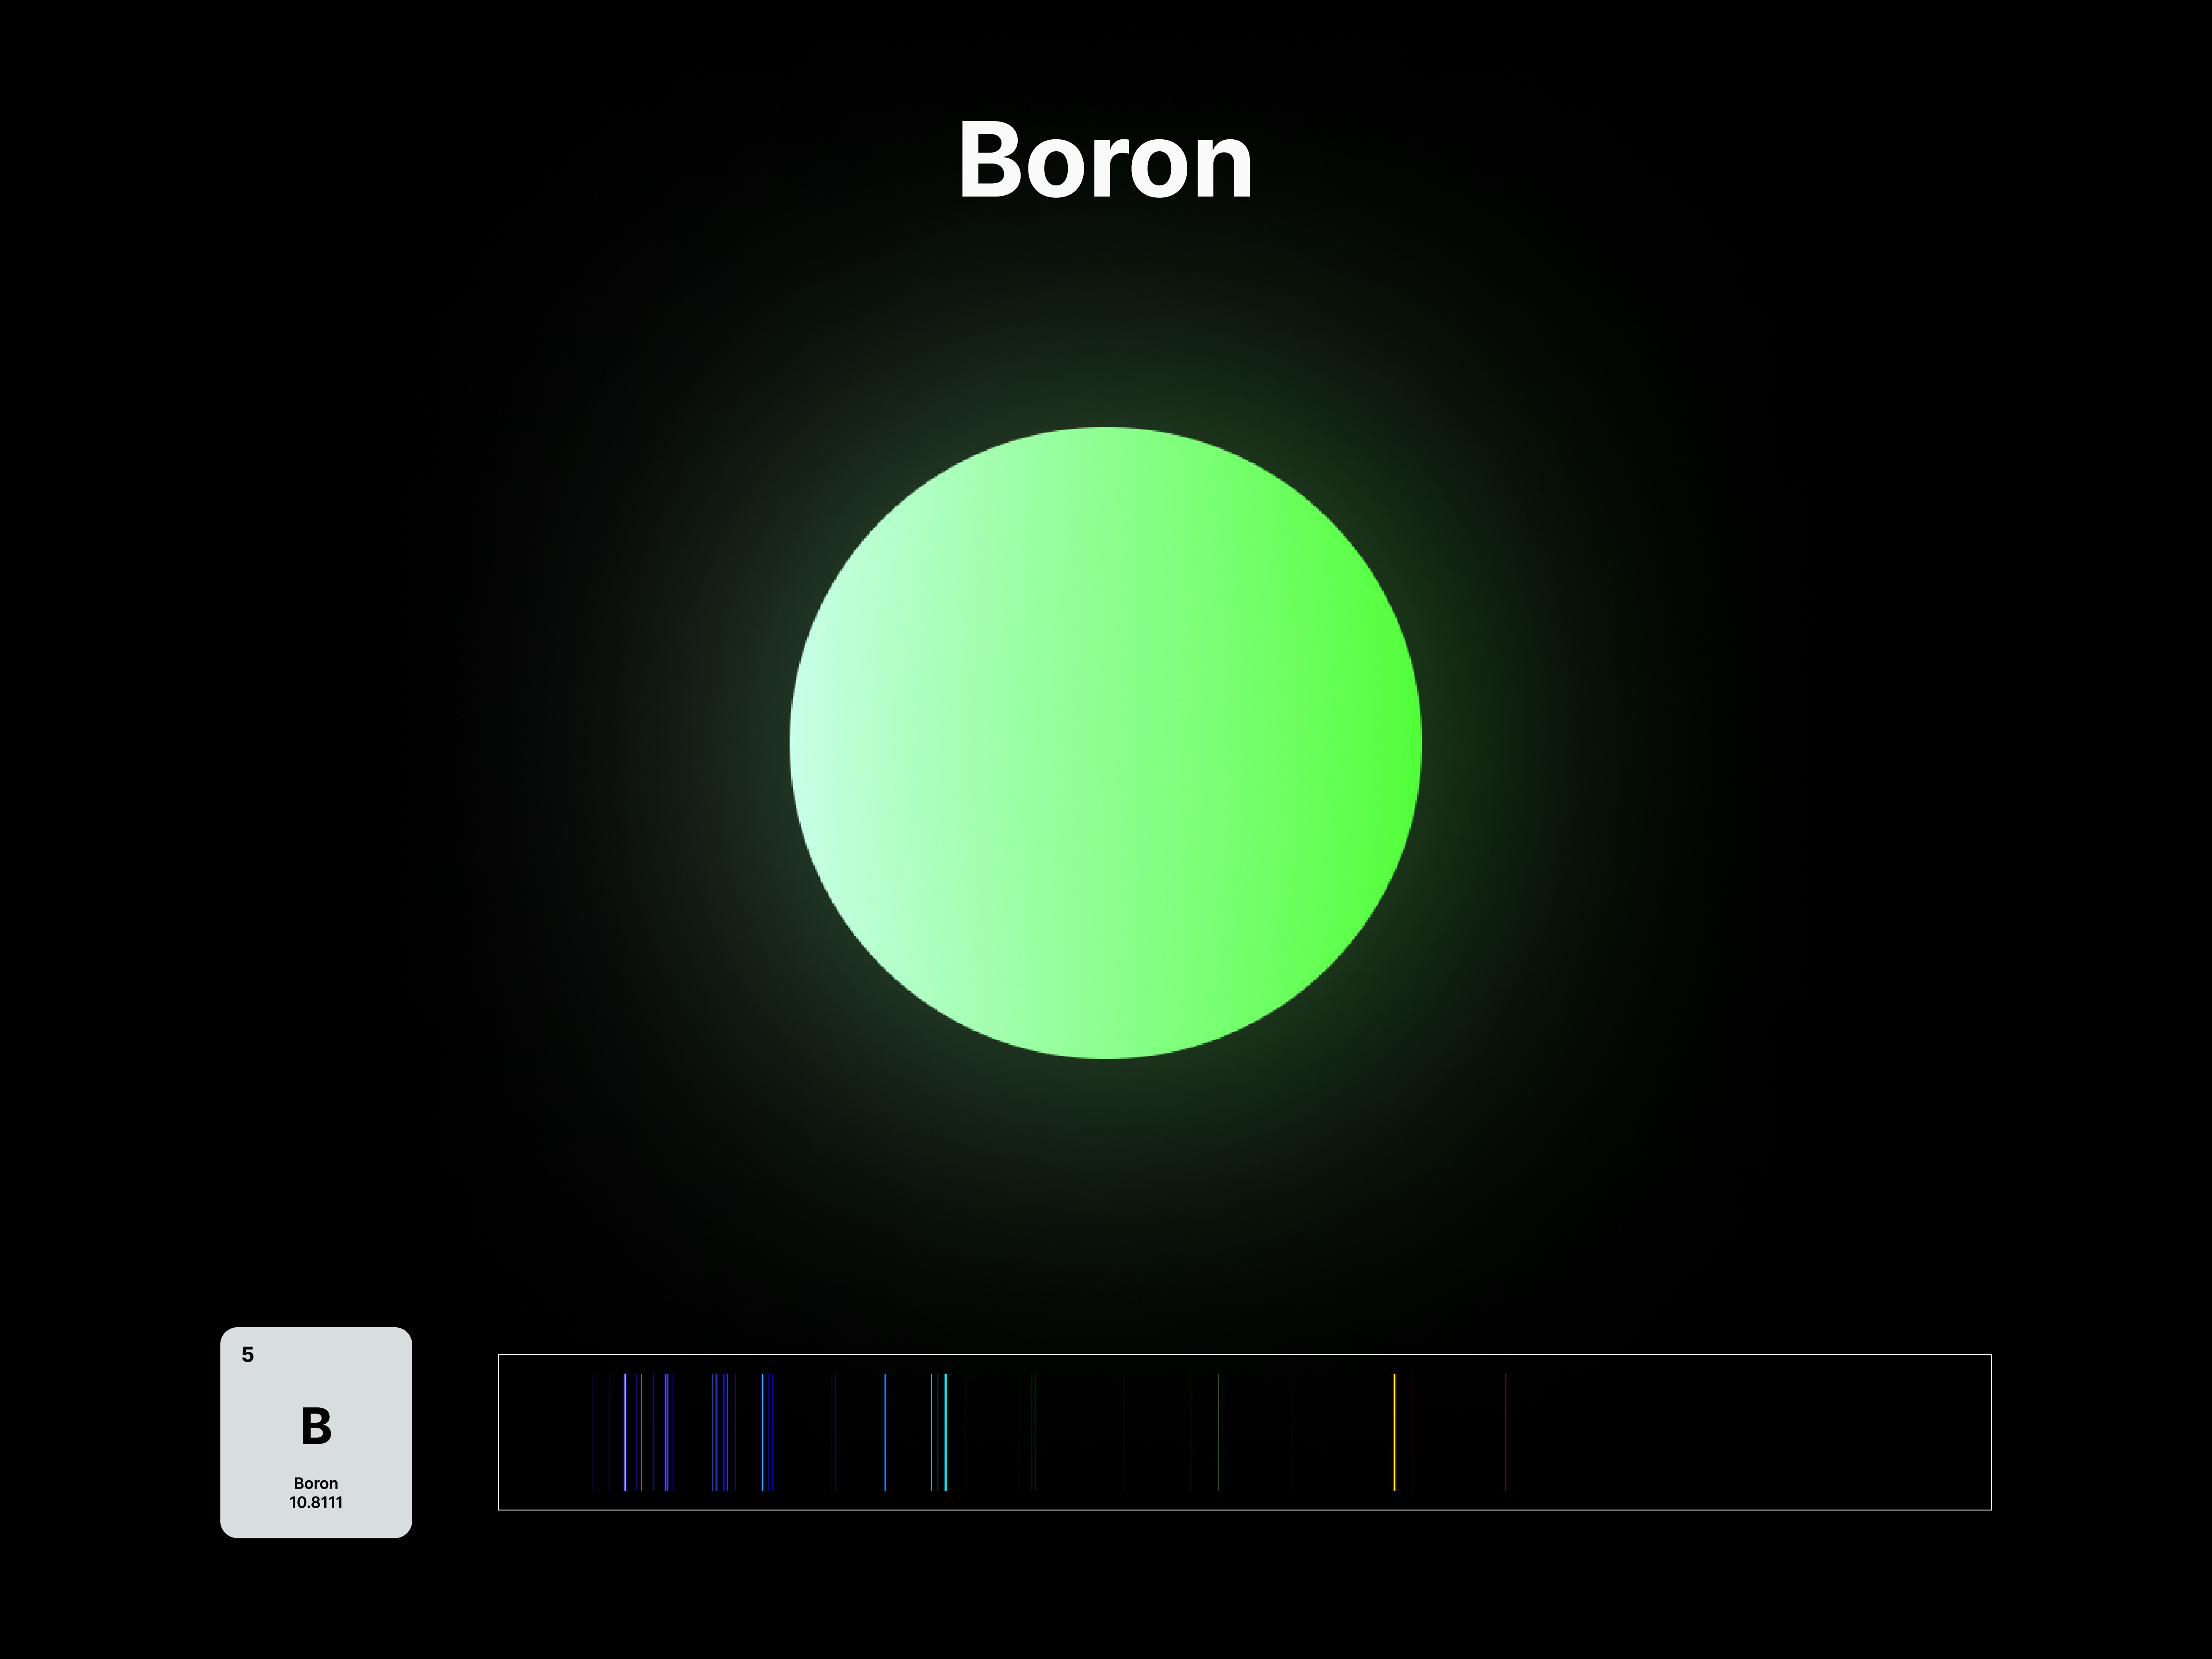
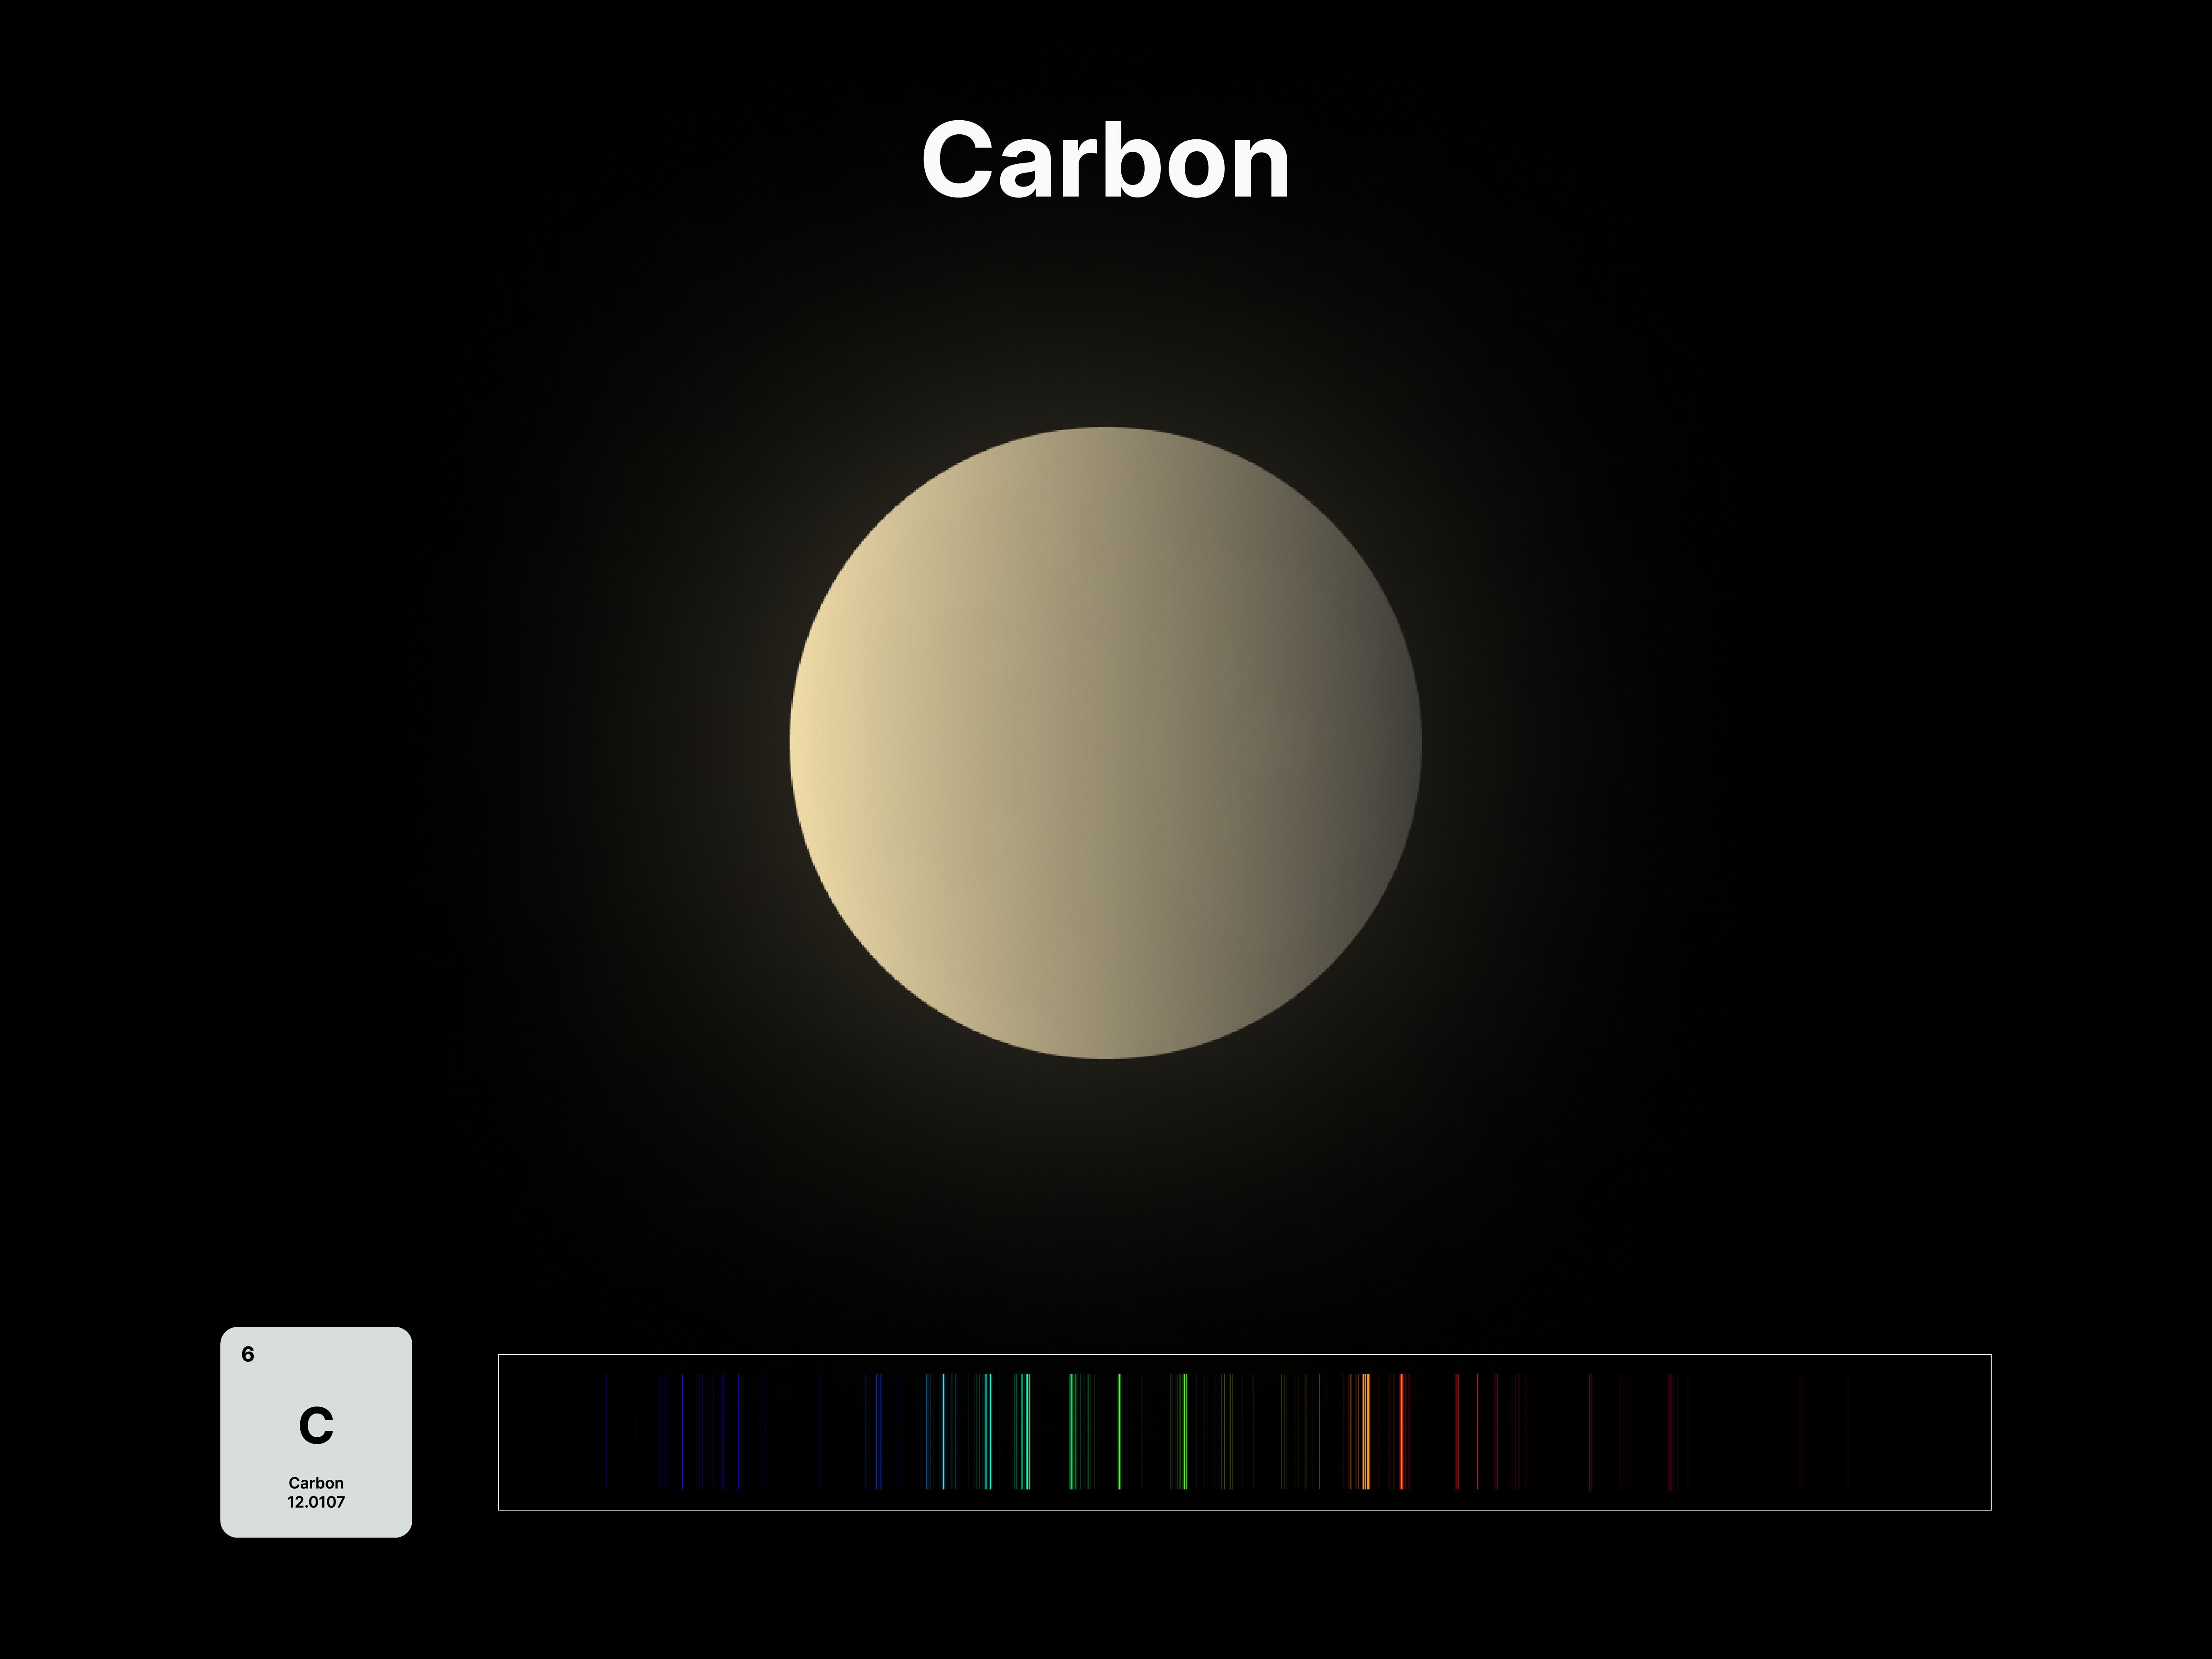
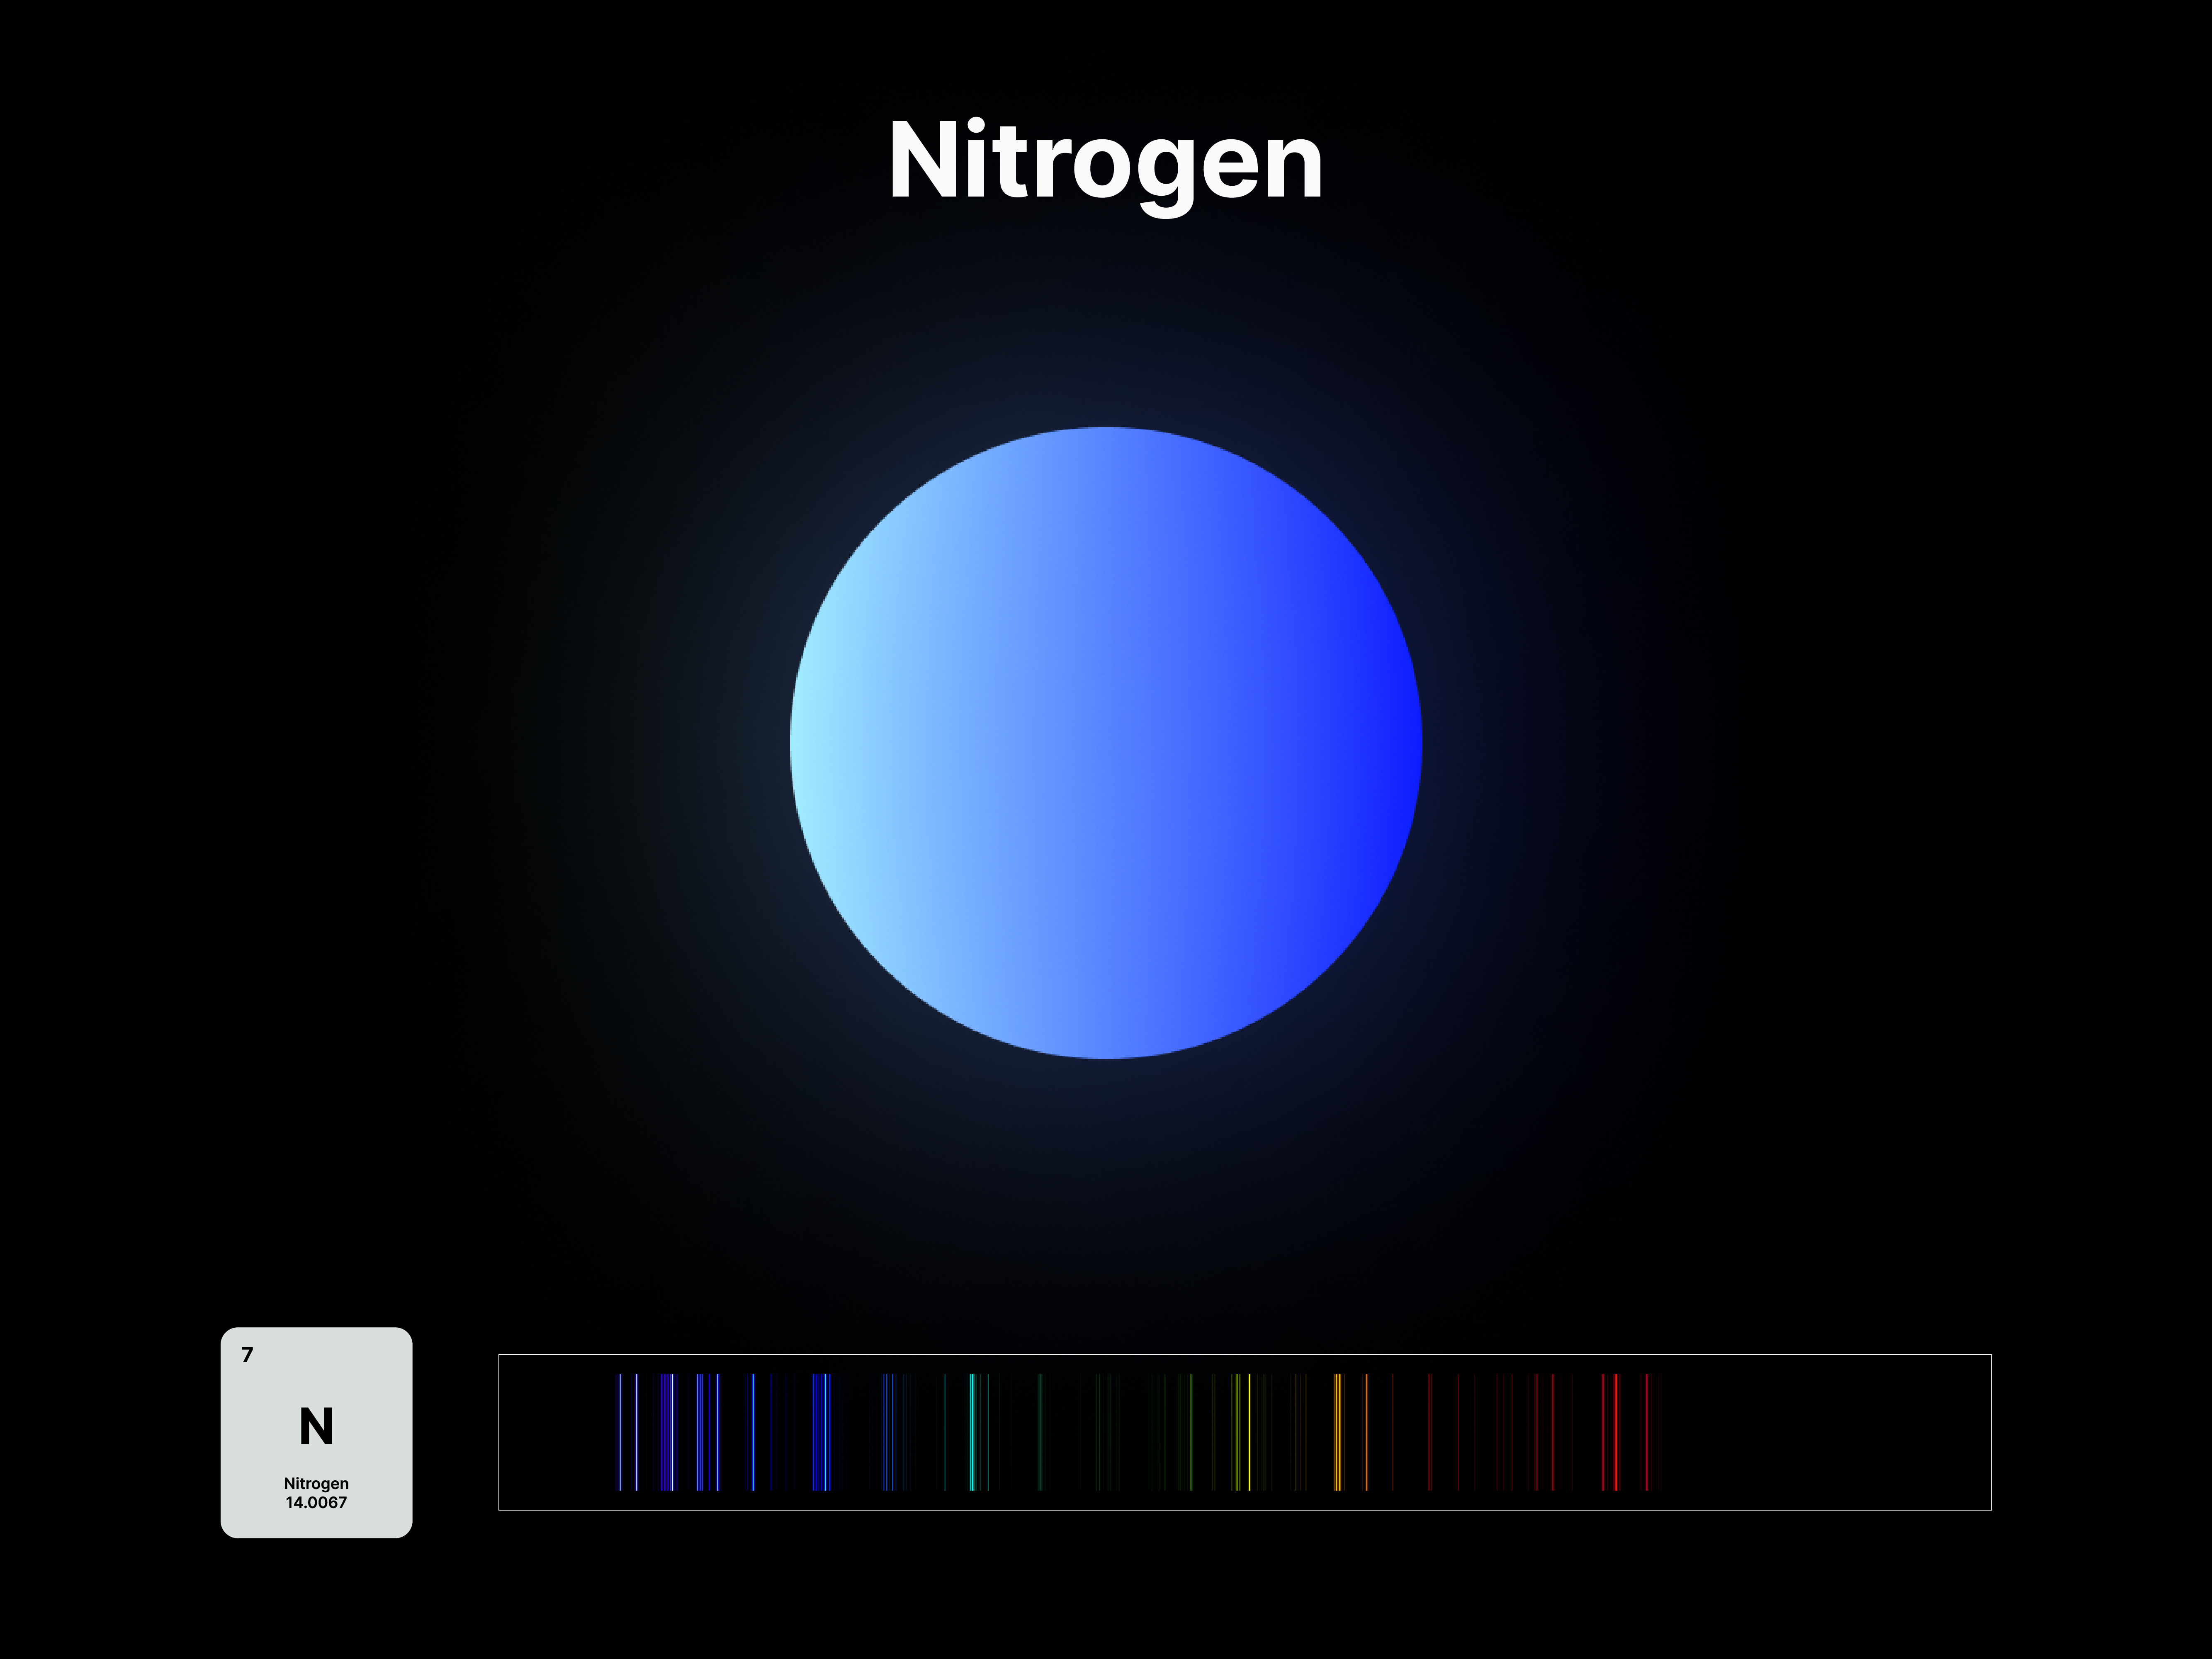
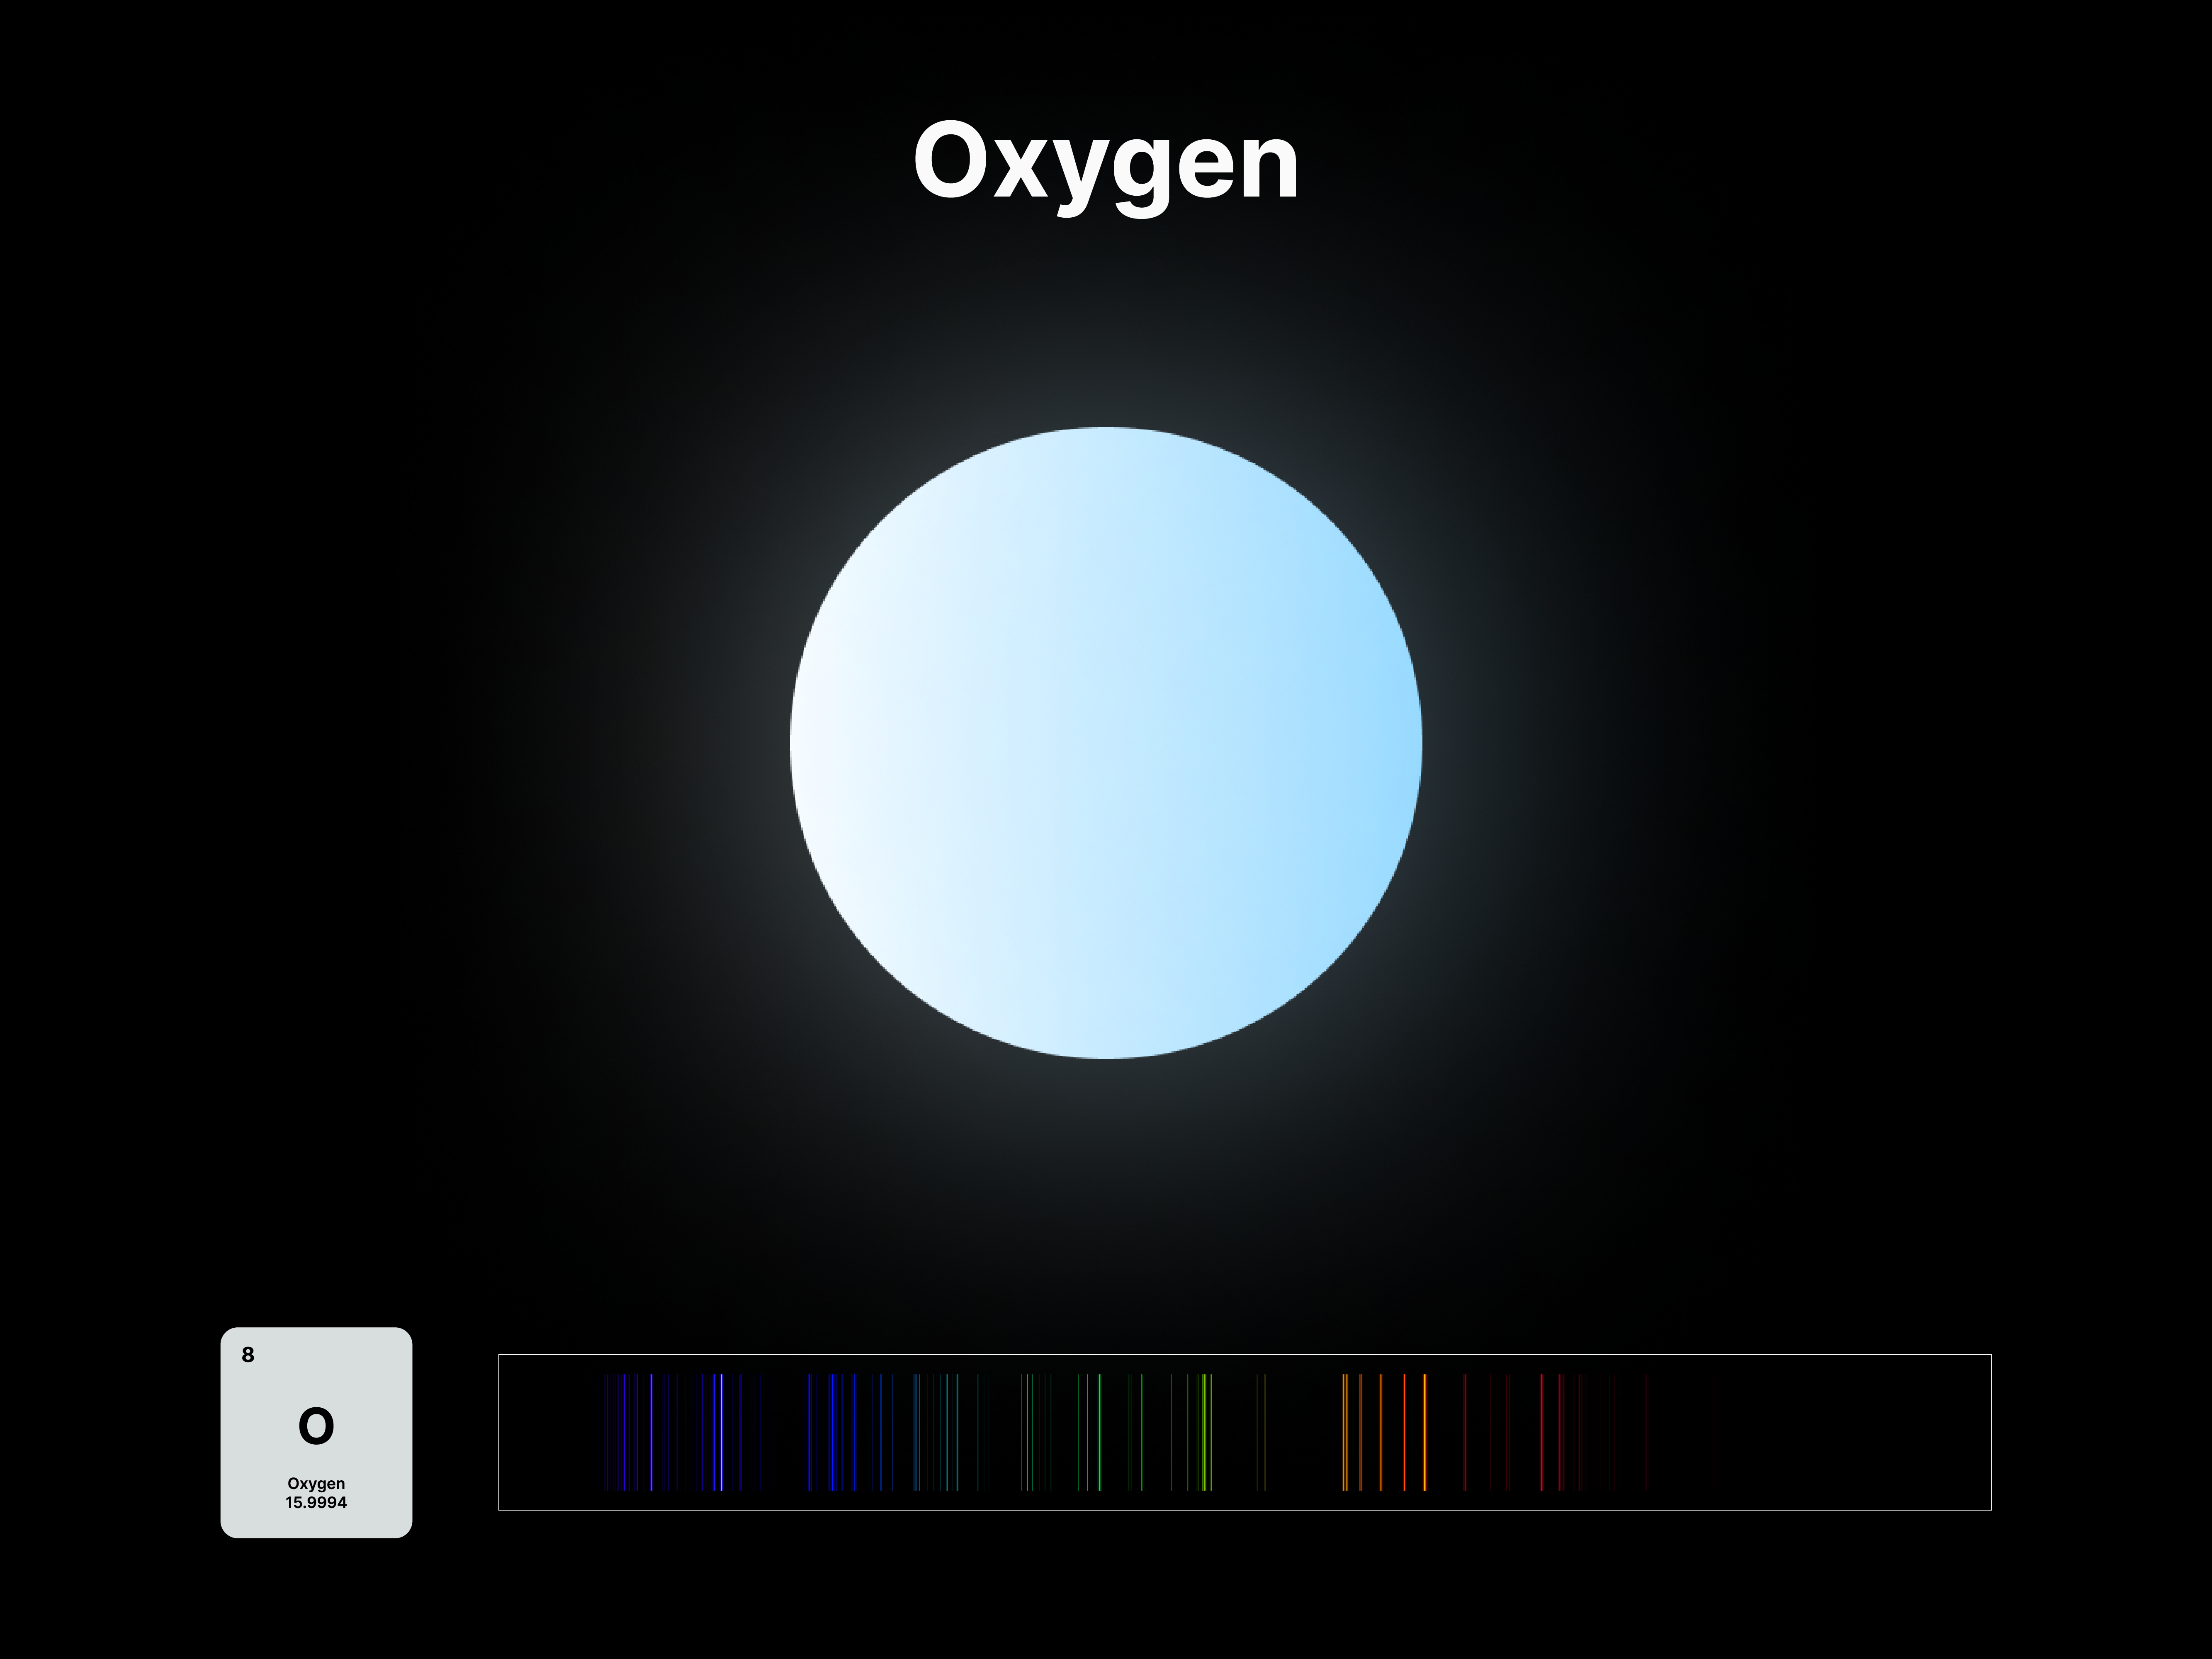
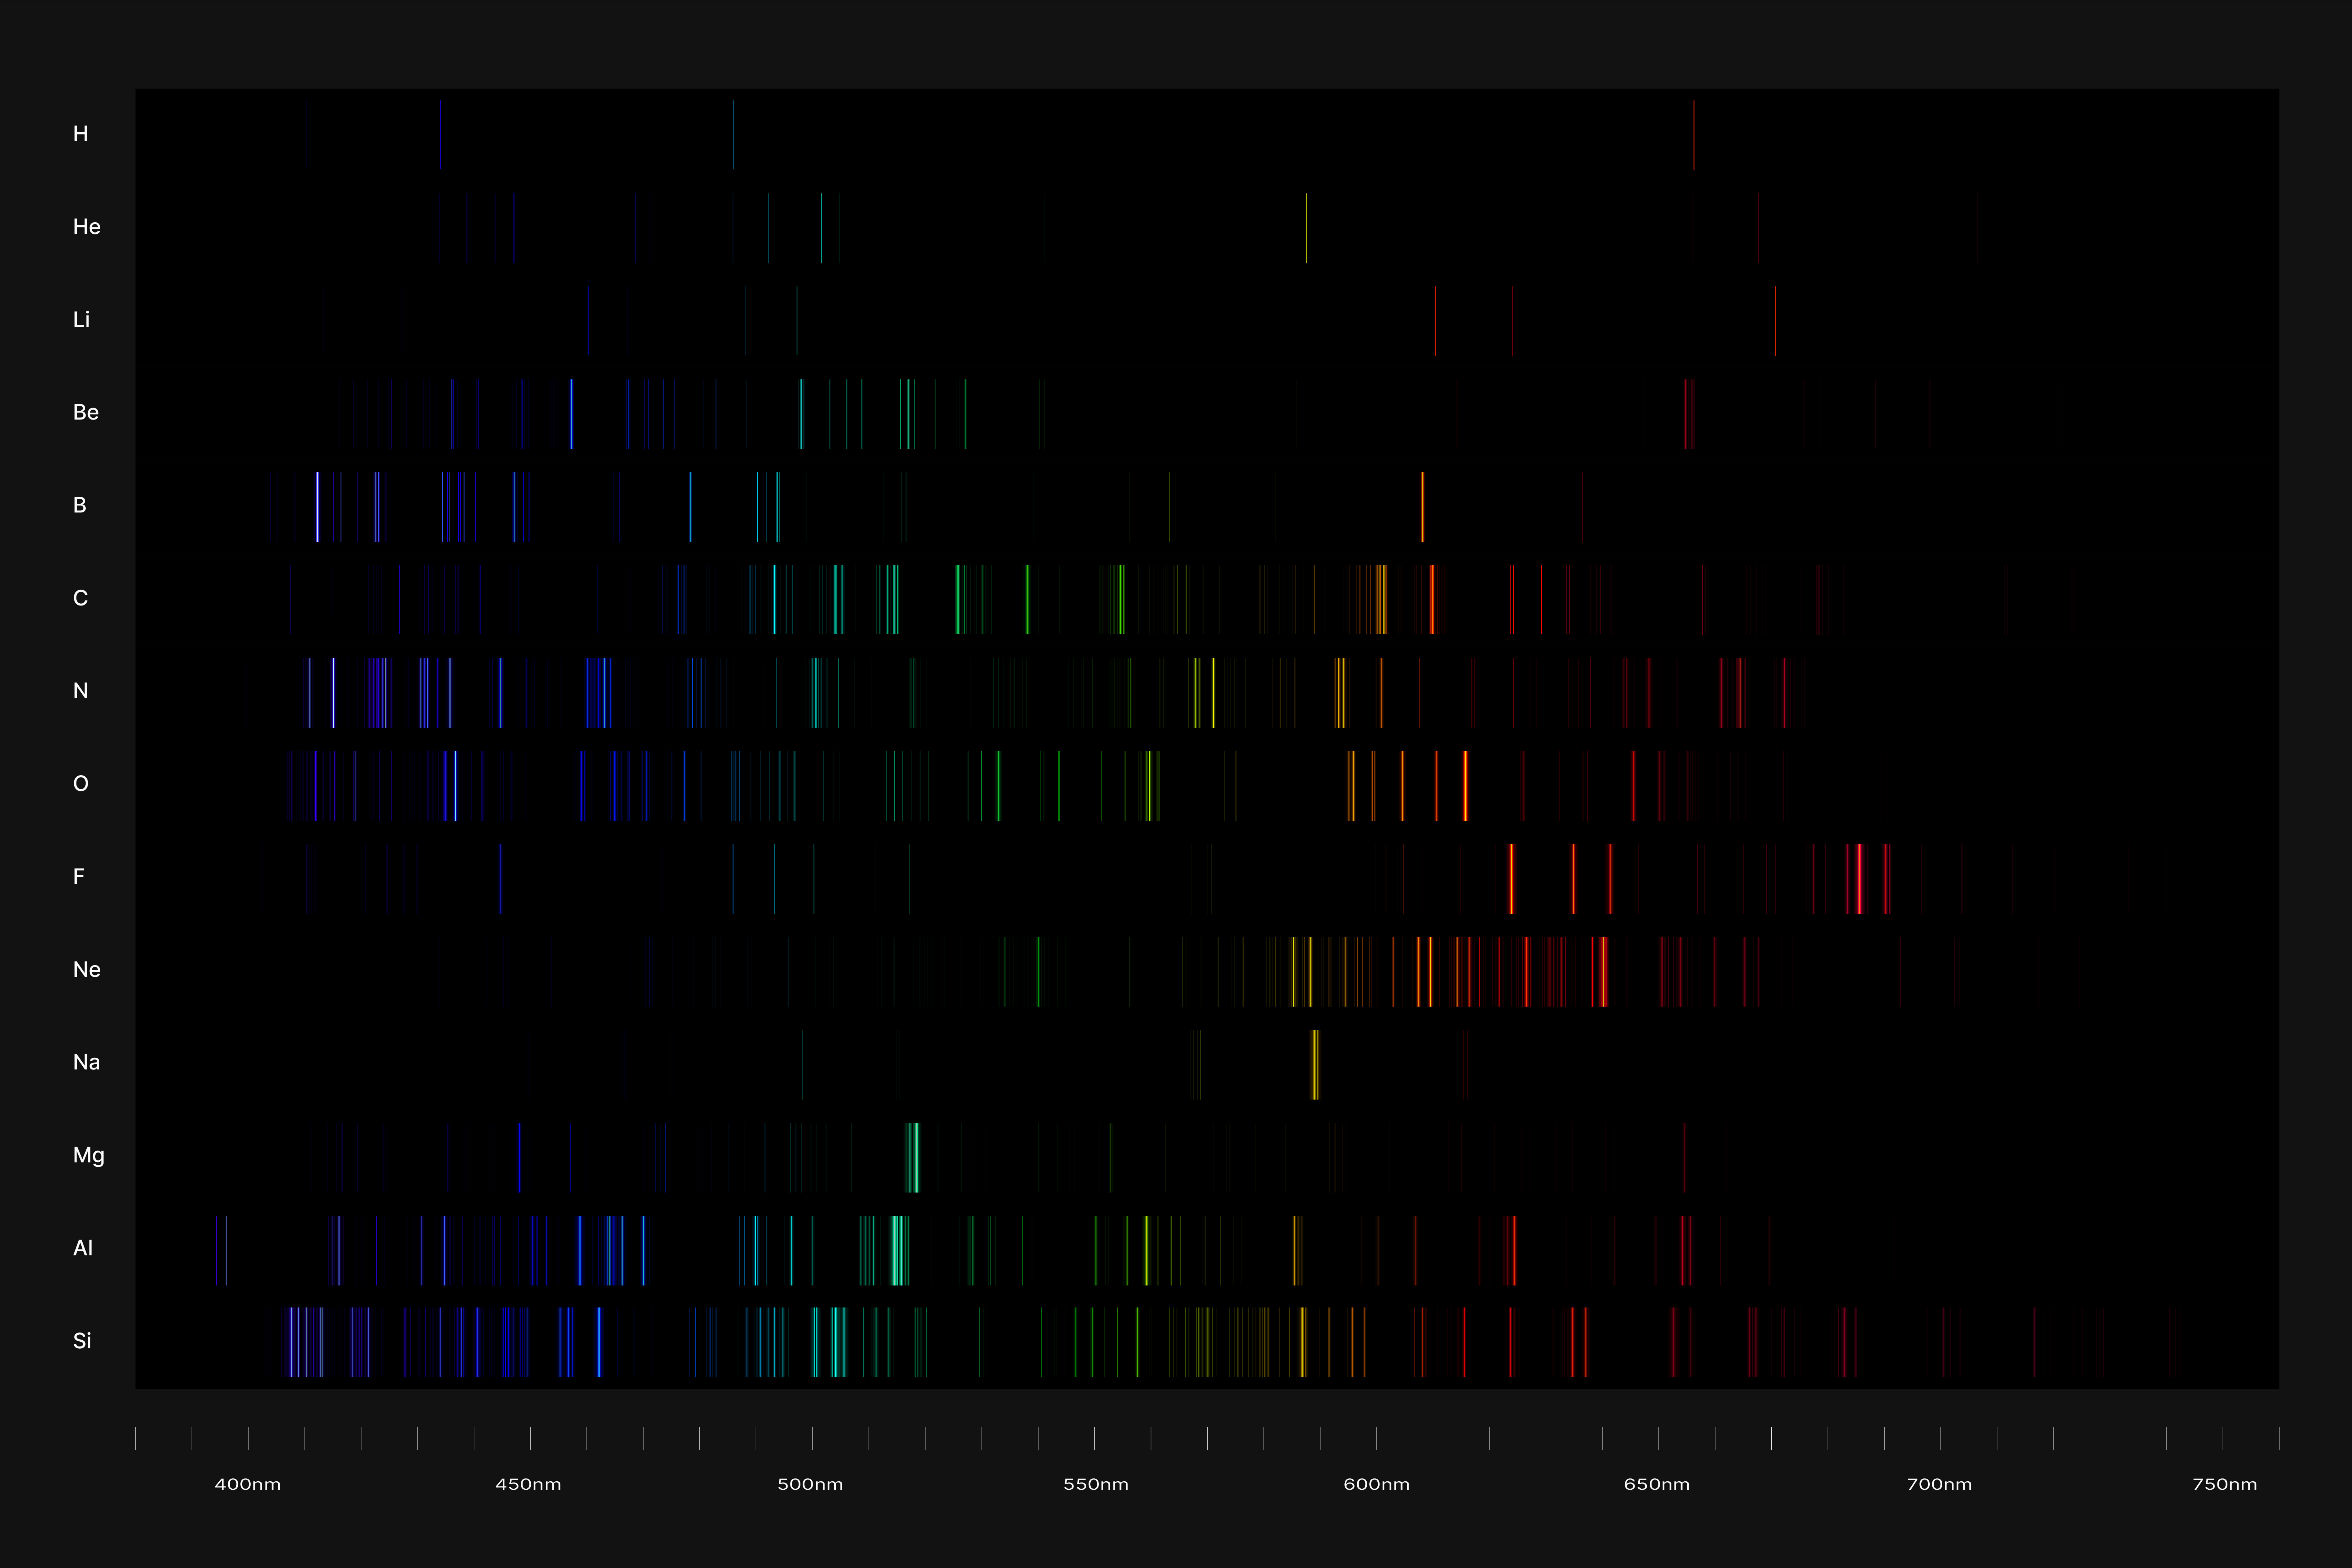
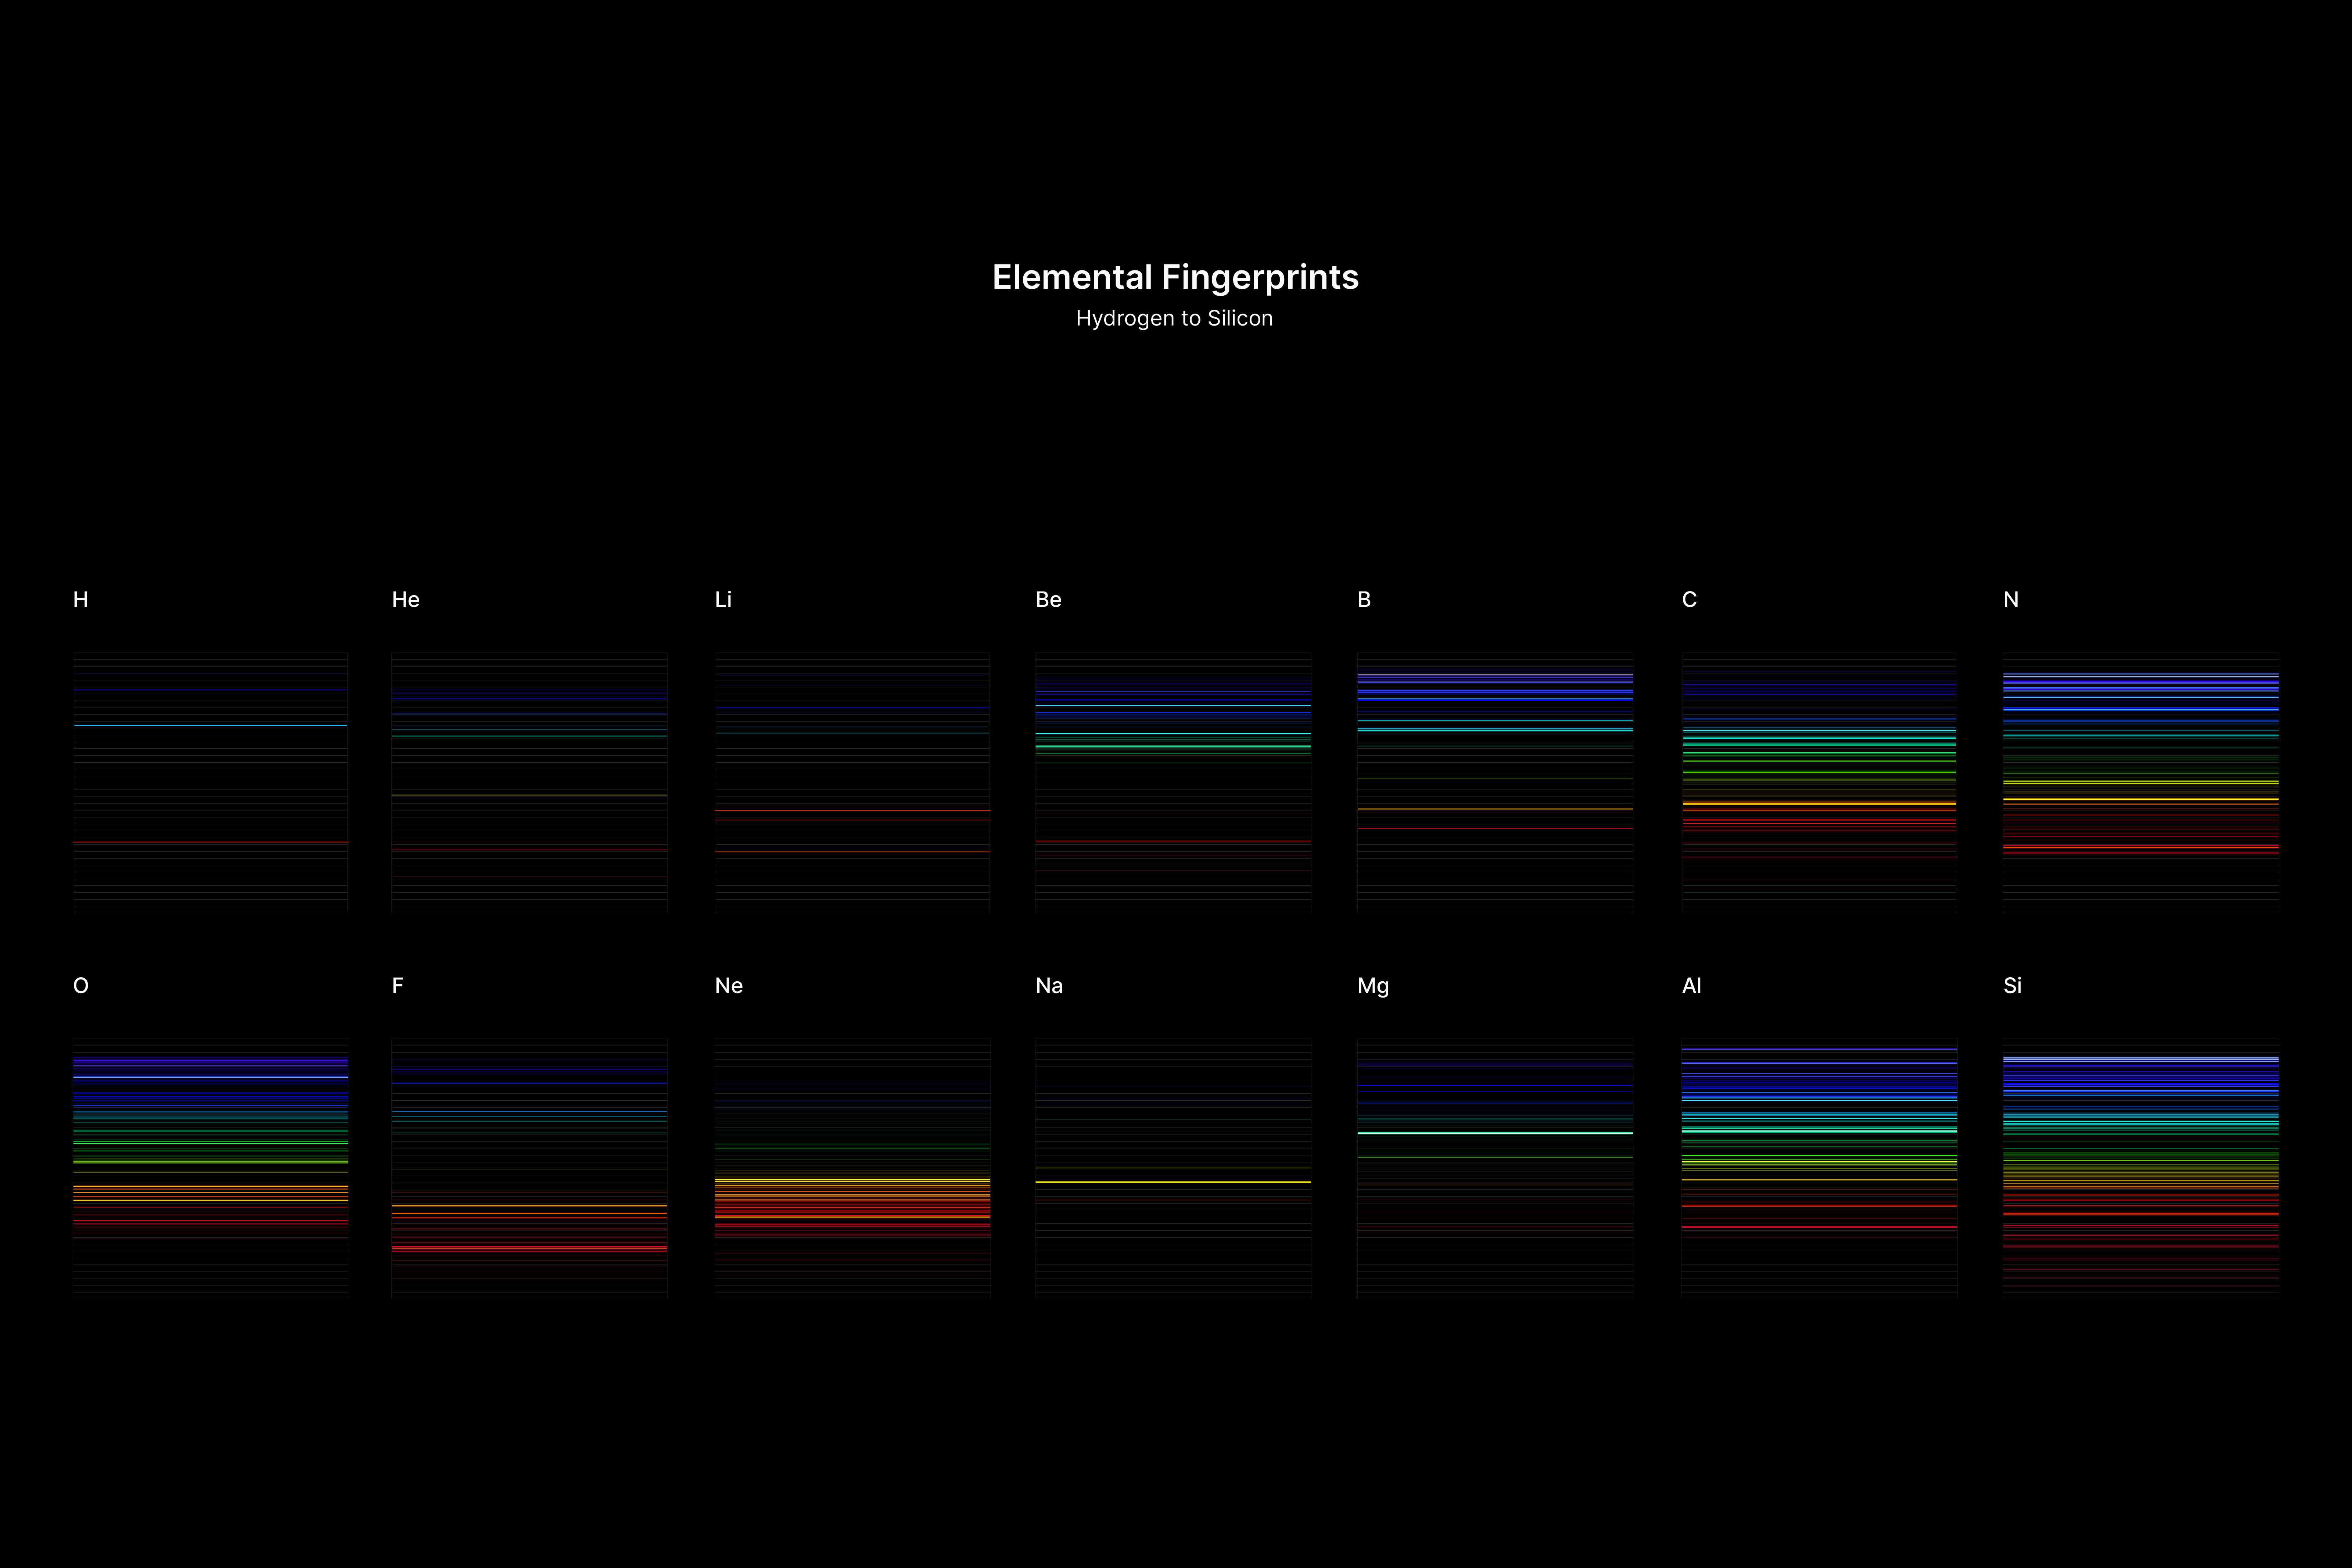
All atoms have a set of discrete energy levels their electrons can exist in, hence they only emit and absorb radiation of specific wavelengths. As the electrons move closer to the nucleus, energy in the form of light is emitted. The transition of electrons within the atom can be observed using a spectroscope, an instrument that analyses the coloured flames created by the elements to generate a unique ‘elemental fingerprint’, in which light is split into a series of coloured lines, rather than a continuous spectrum. Hence, studying the spectral lines produced by elements allows us to identify the matters in the Universe, stars and within ourselves; a concept explored in this project.
Elemental Fingerprint
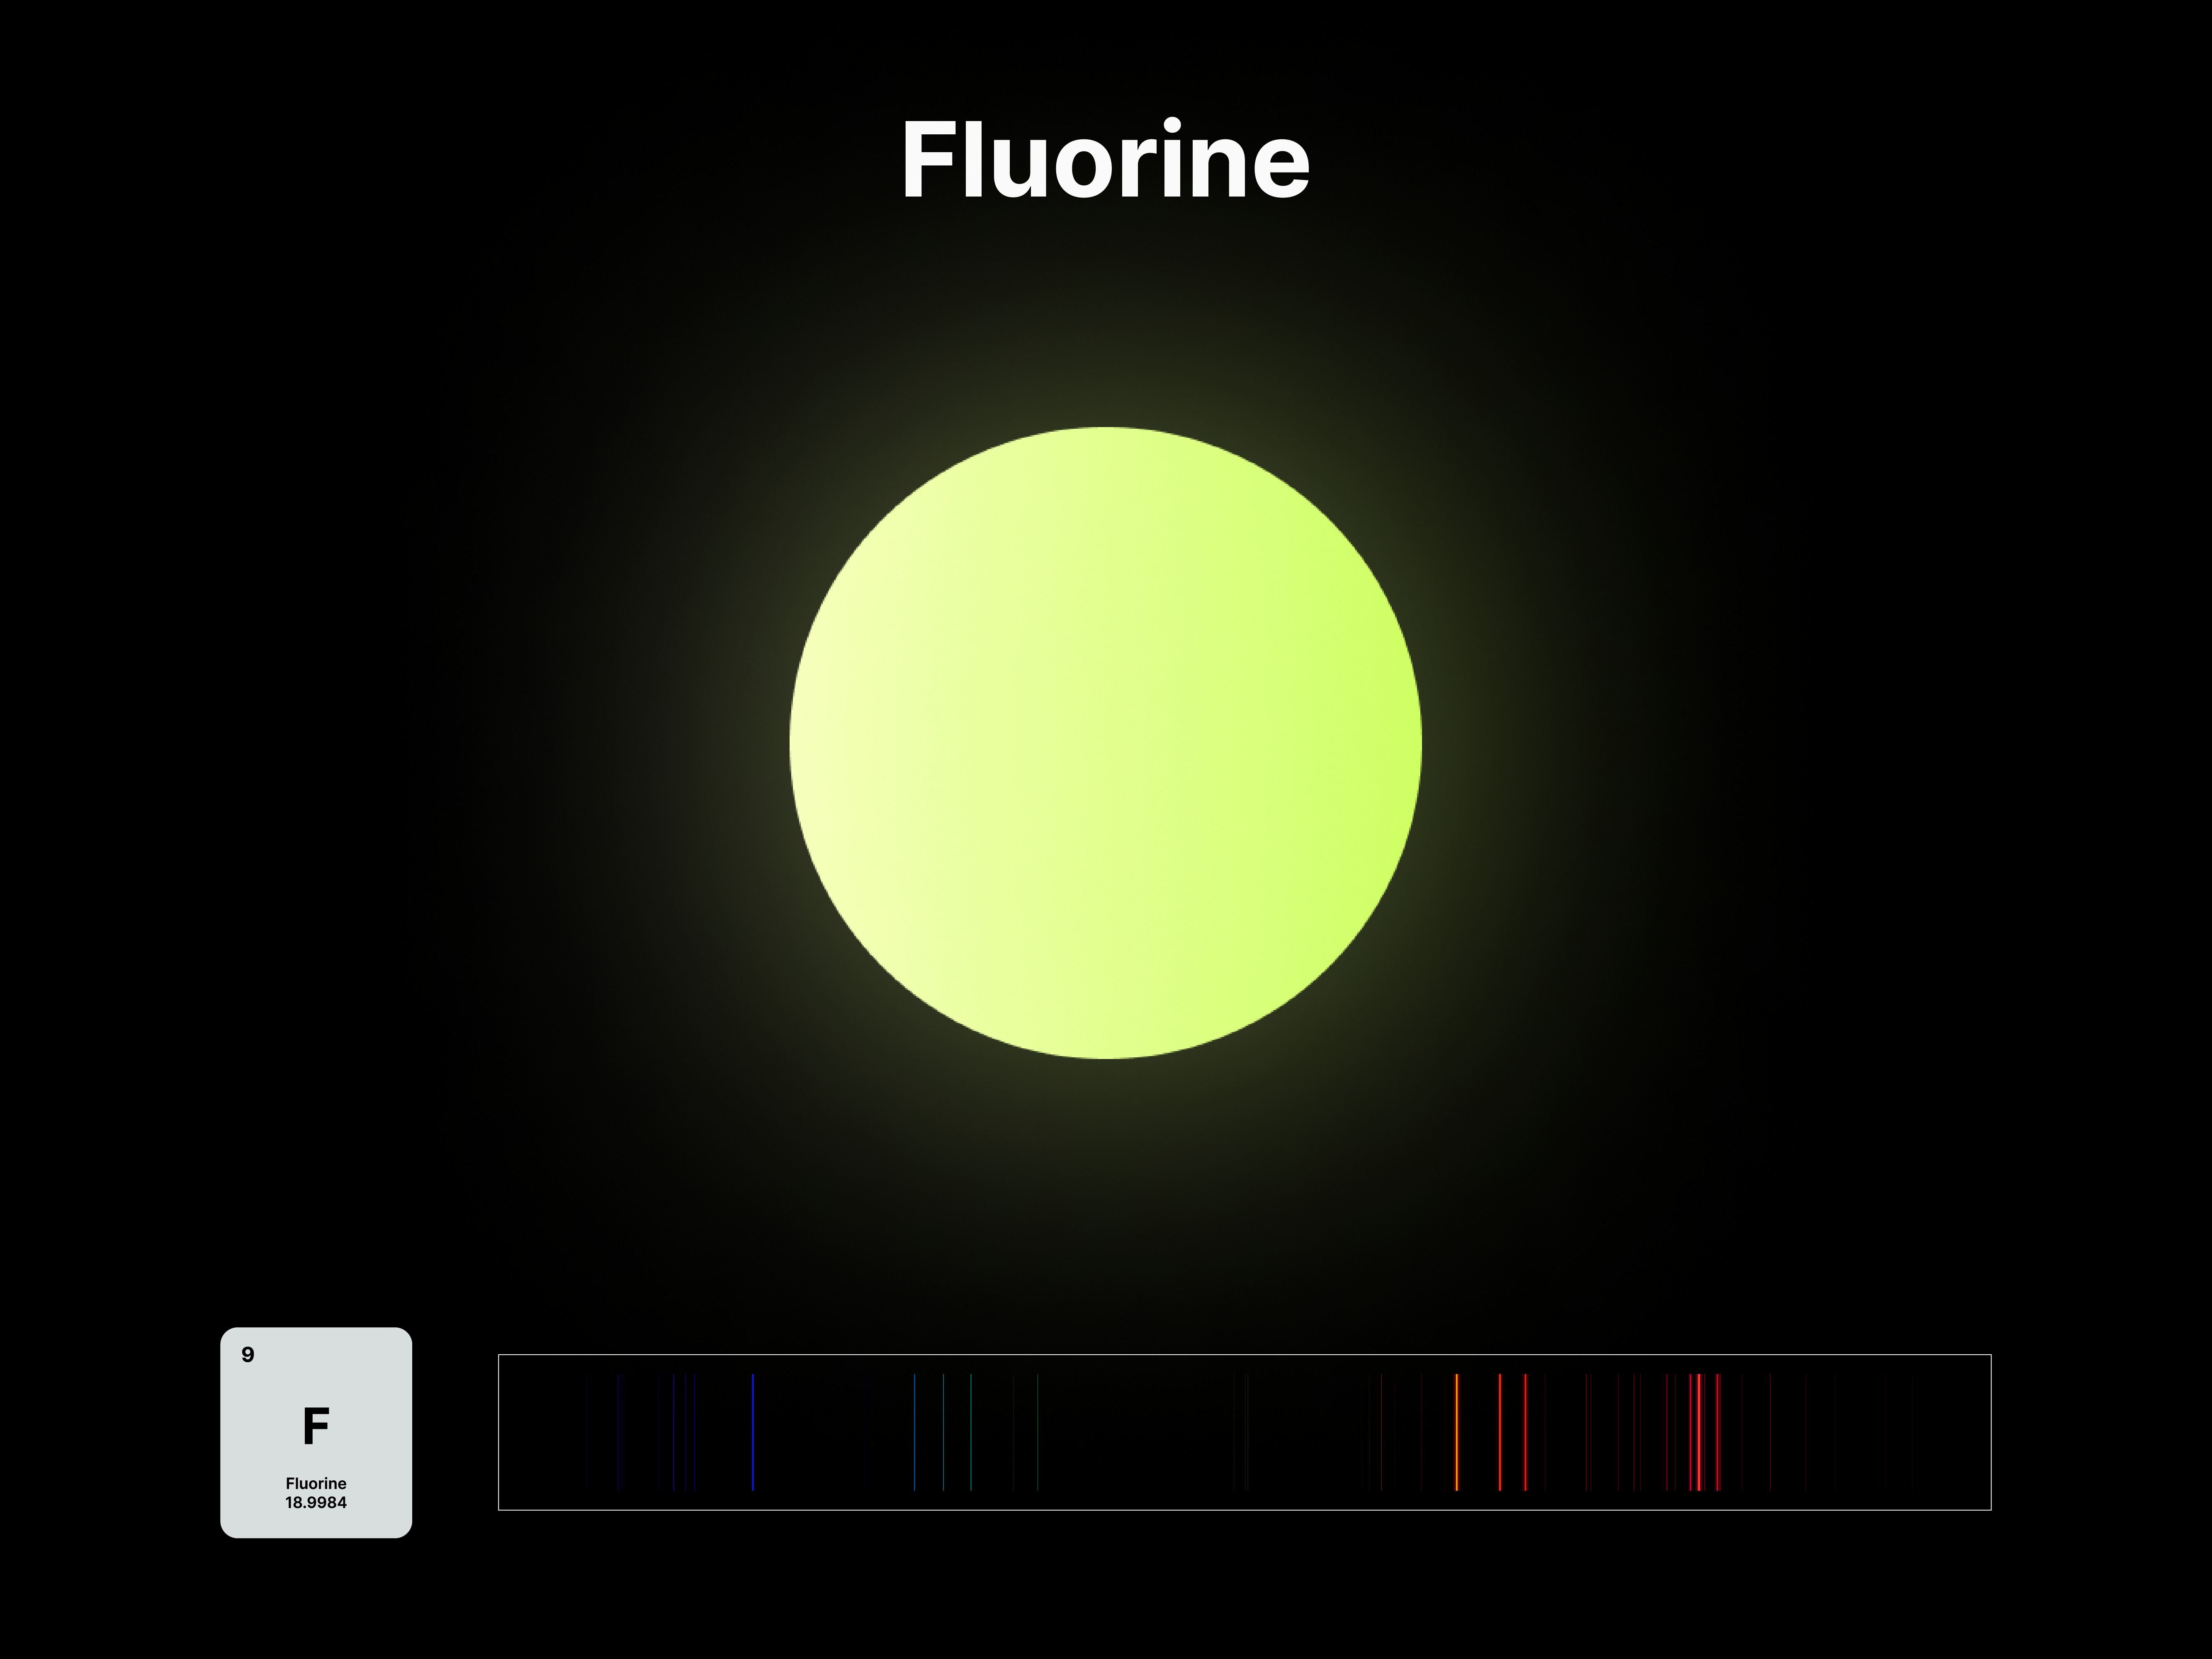
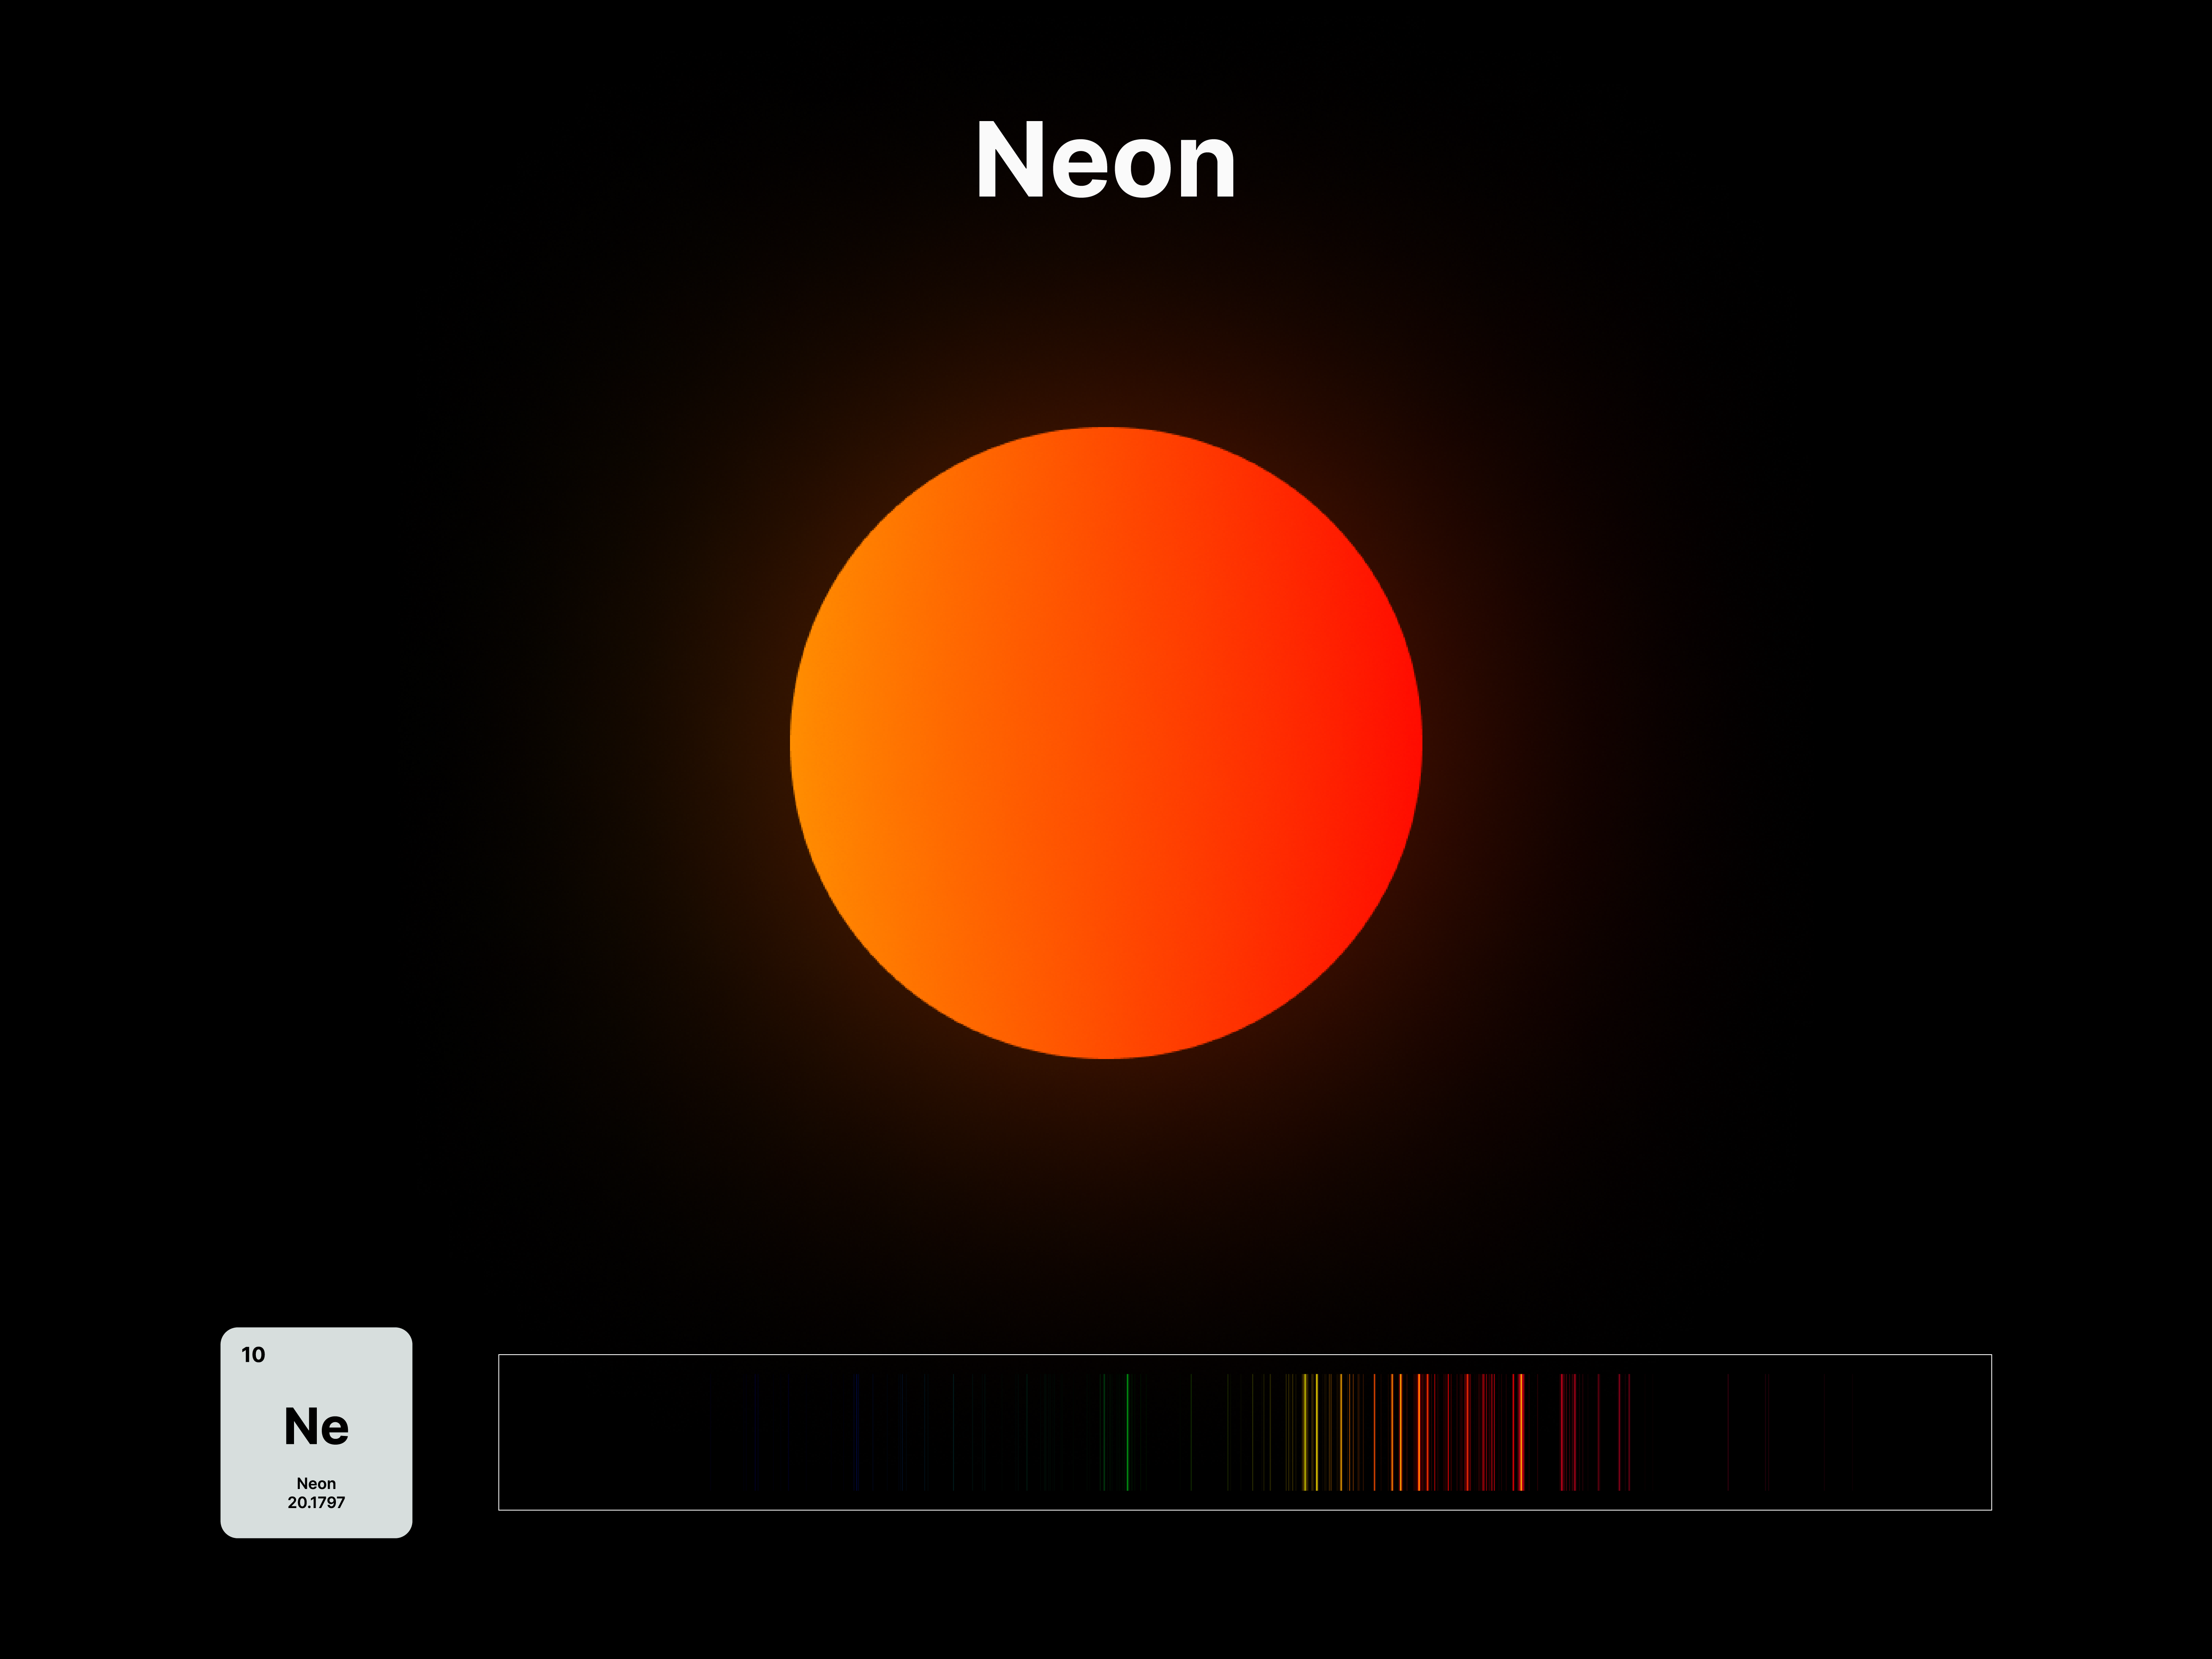
The emission spectrums of the 14 elements, ranging from Hydrogen (atomic number 1) to Silicon (atomic number 14), are unique fingerprints that are visual representations of their identities. To package the qualities of each element into digestible forms, their fingerprints were paired with a simplified representation of their atom accordingly. The above is a visual summary that can be likened to an identification card. Although most of the elements are colourless in their pure form, the colours used for these minimal particles are associated with colours that the elements demonstrate at different states. For example, Lithium (atomic number 3) imparts a red colour flame when heated.
After these elements’ identities are established, the following data visualisations was done to contextualise their roles in two different scales: The Universe and the human body.
Data Visualisation
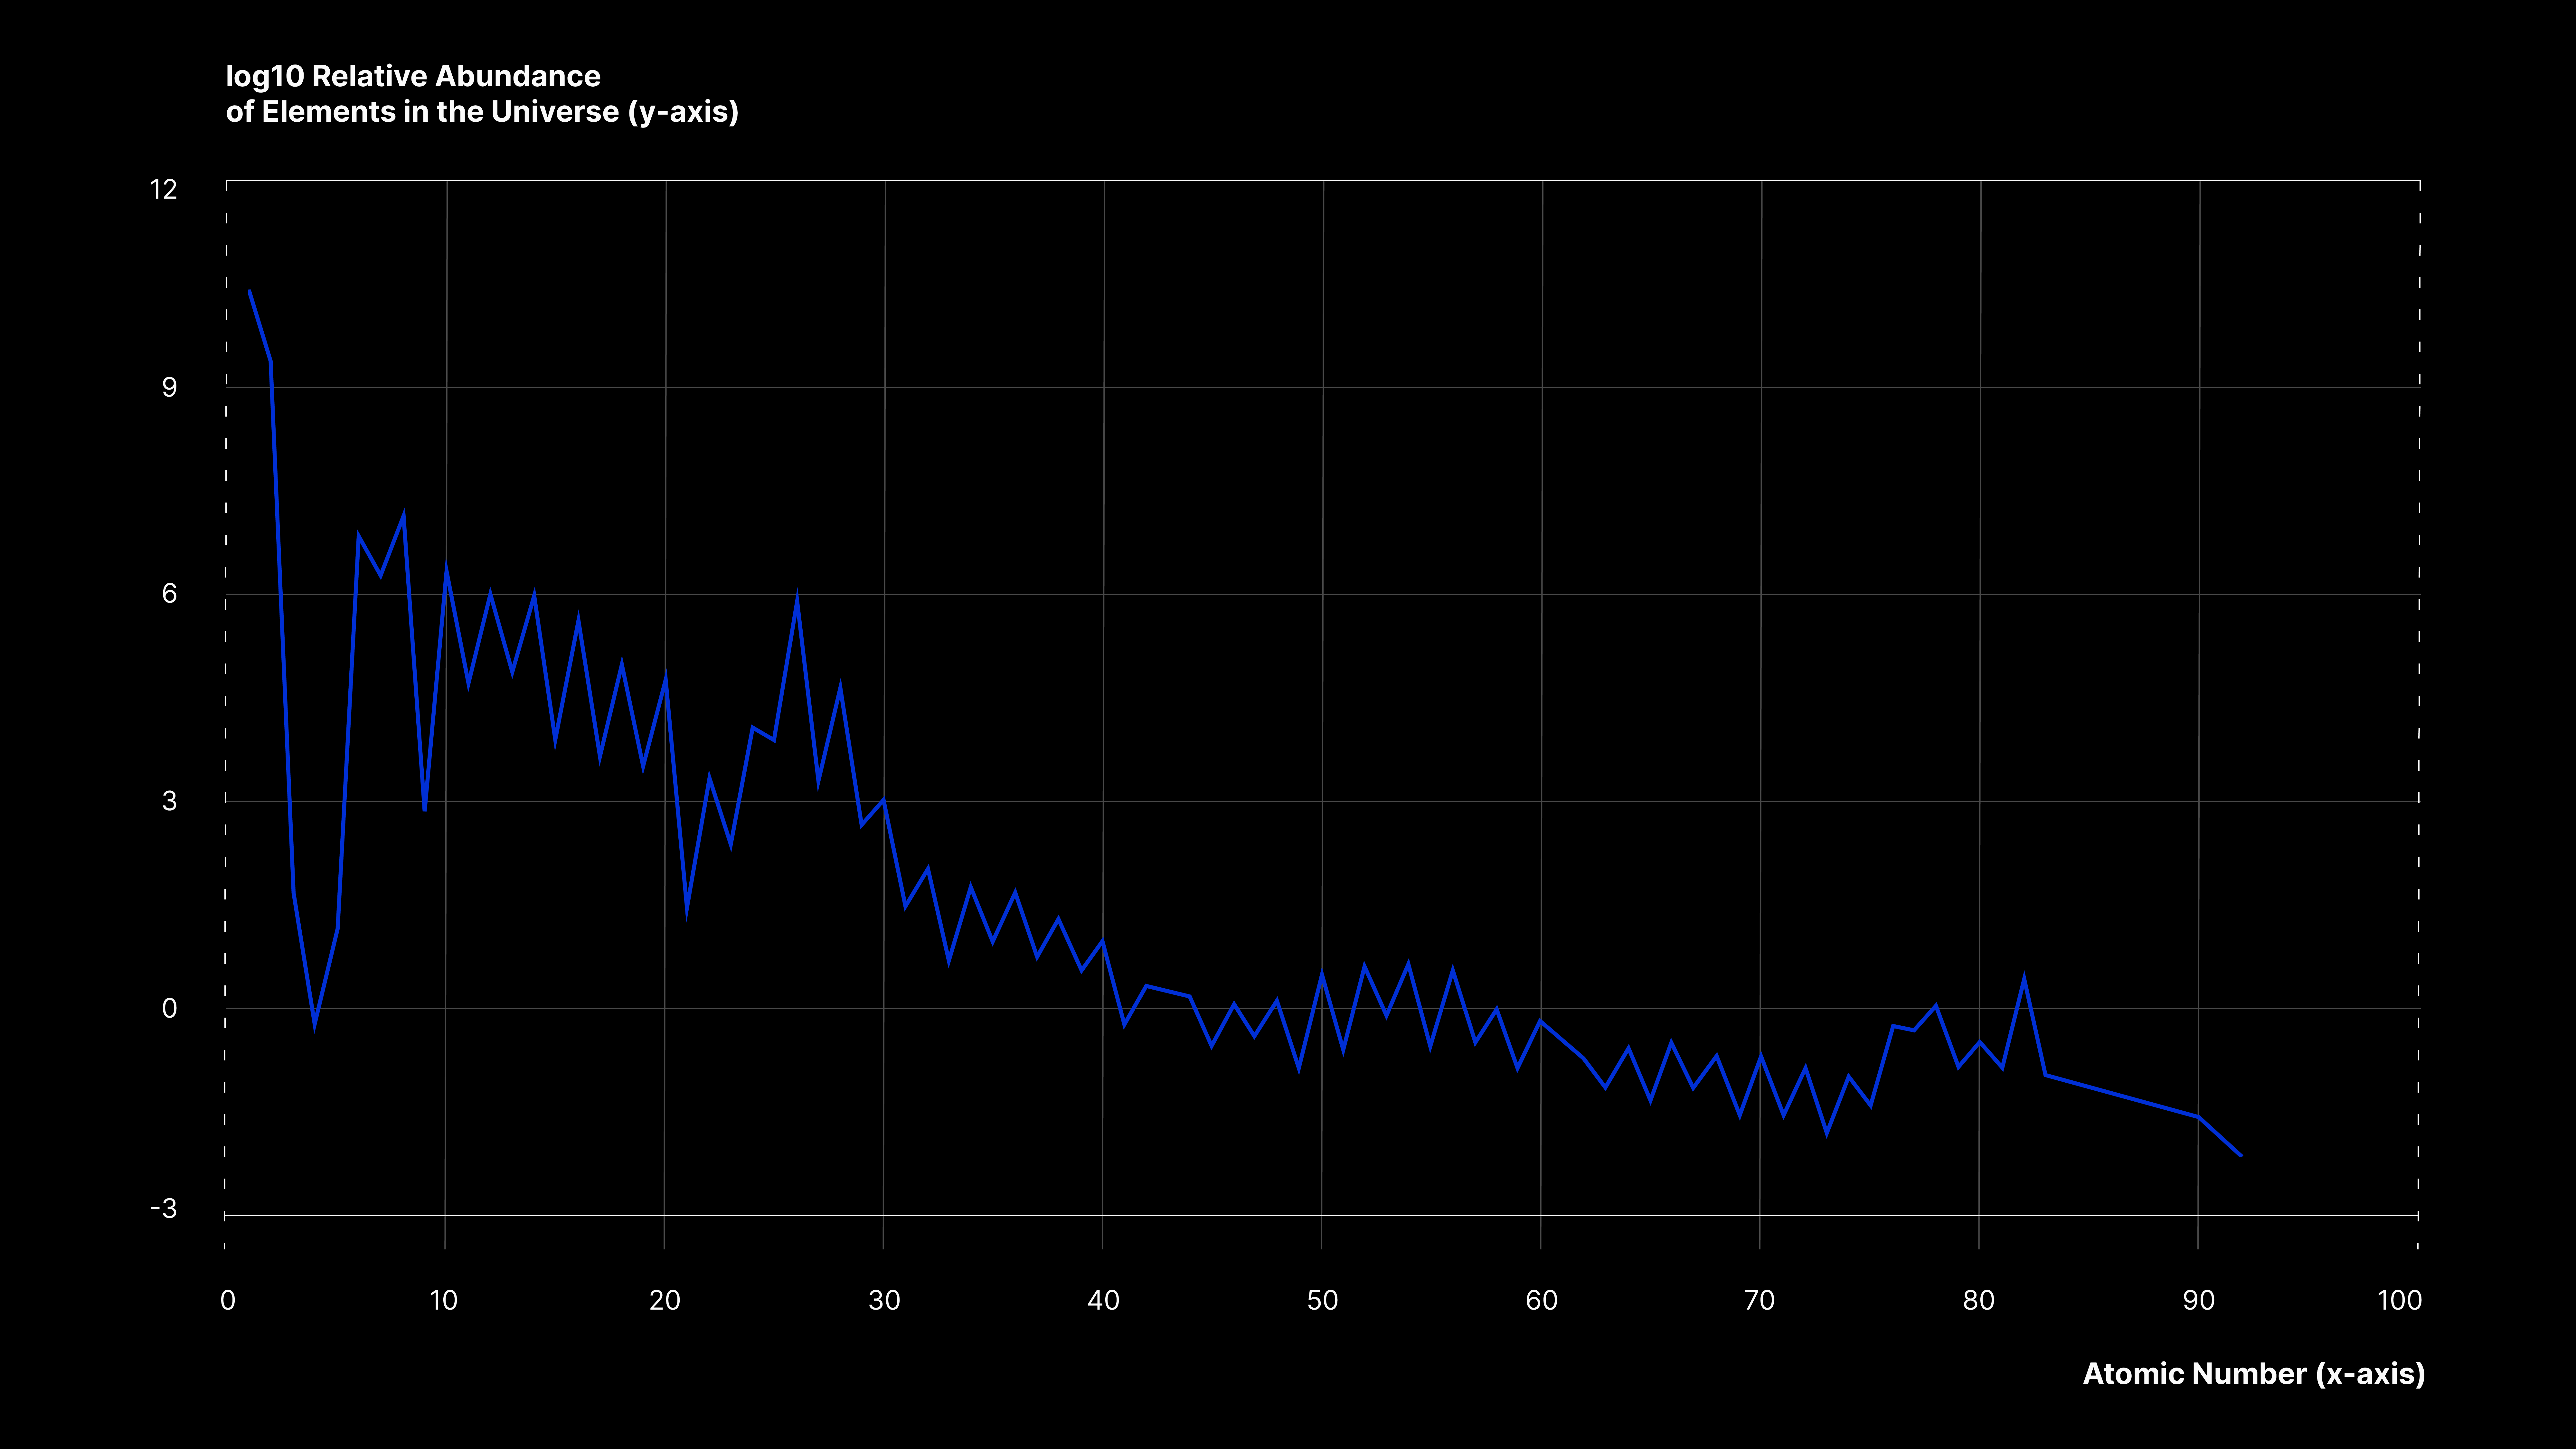
The abundance of the chemical elements is a measure of their occurrence relative to all other elements in a specialised environment, such as atmospheres, stars, oceans, or the human body. Interestingly, spectral lines can give us information on what elements are present in a star’s photosphere as well as its abundance. The above line graph demonstrates the relative abundance of chemical elements in the Universe, indicating how the elements vary widely in abundance and decrease exponentially with the atomic number.
Findings
The line graph gives us a general trend and perception of the abundance of elements in the Universe. It can be observed that Hydrogen is the most common element, followed by Helium. However, the rank of abundance does not continue to correspond to the atomic number after Hydrogen and Helium; Oxygen is the third most common, but it has an atomic number of 8. For a different perspective on abundance, the statistical data on elemental composition is further explored and contextualised in the donut graphs below.
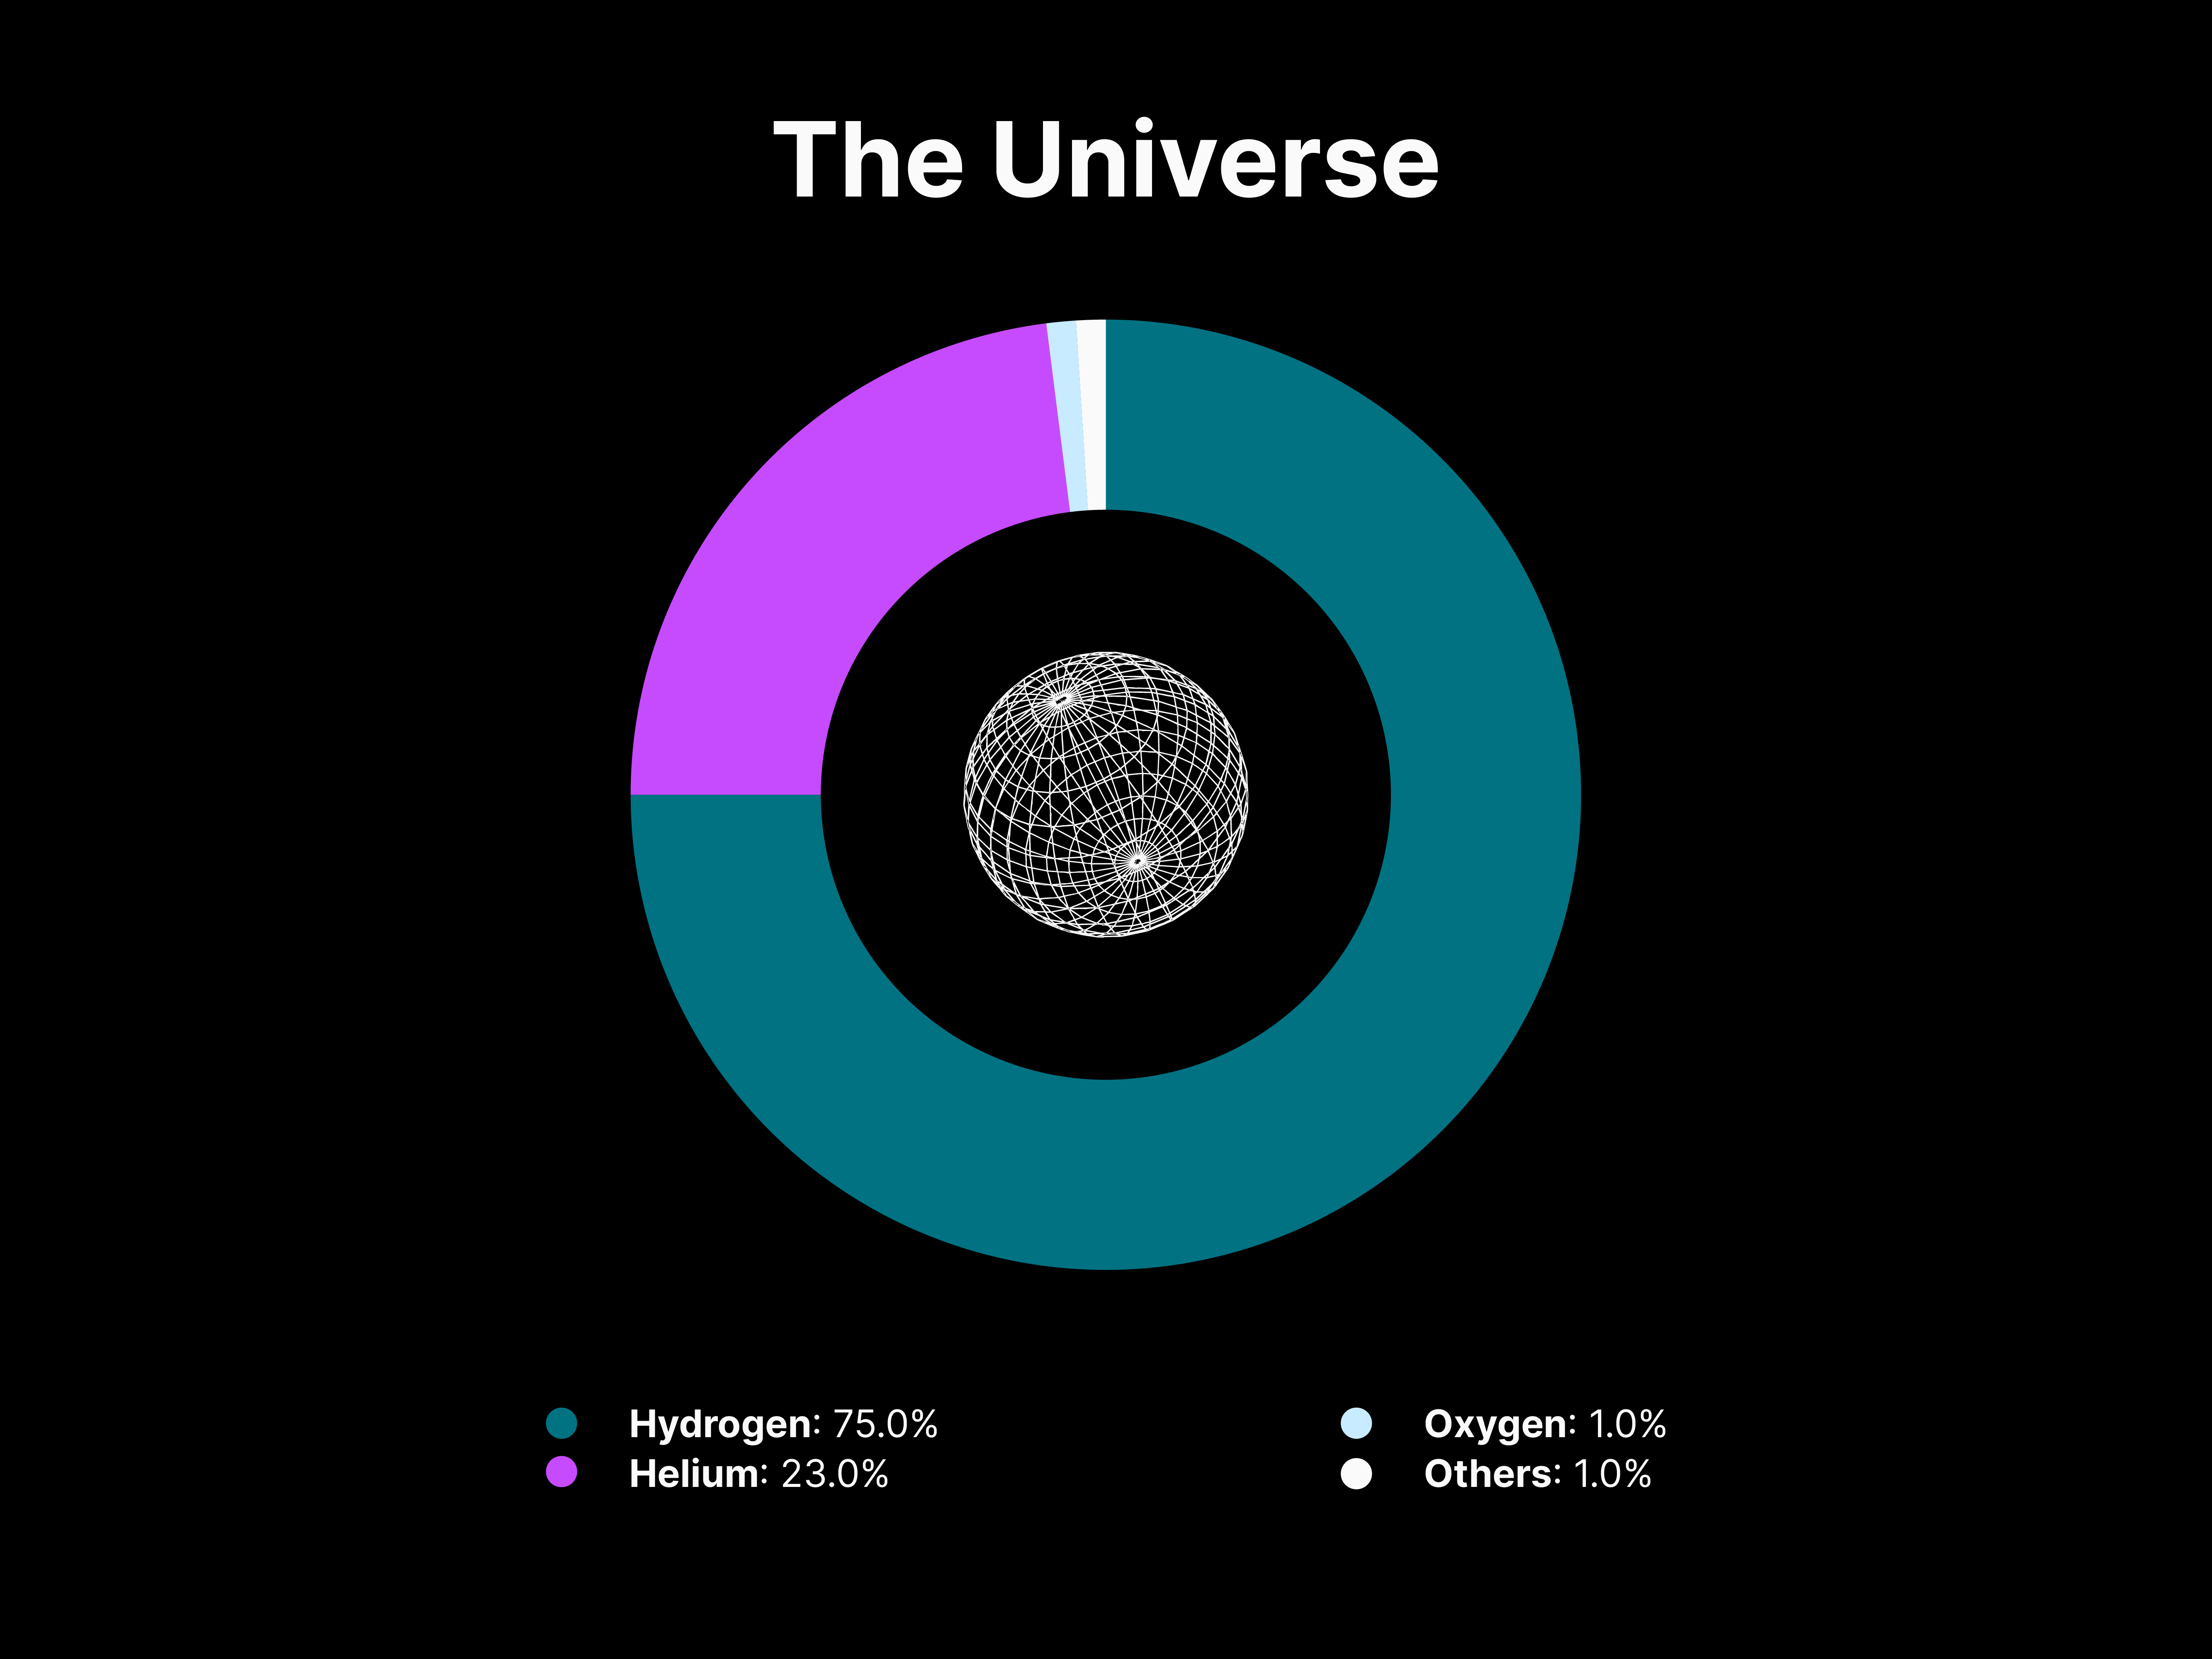
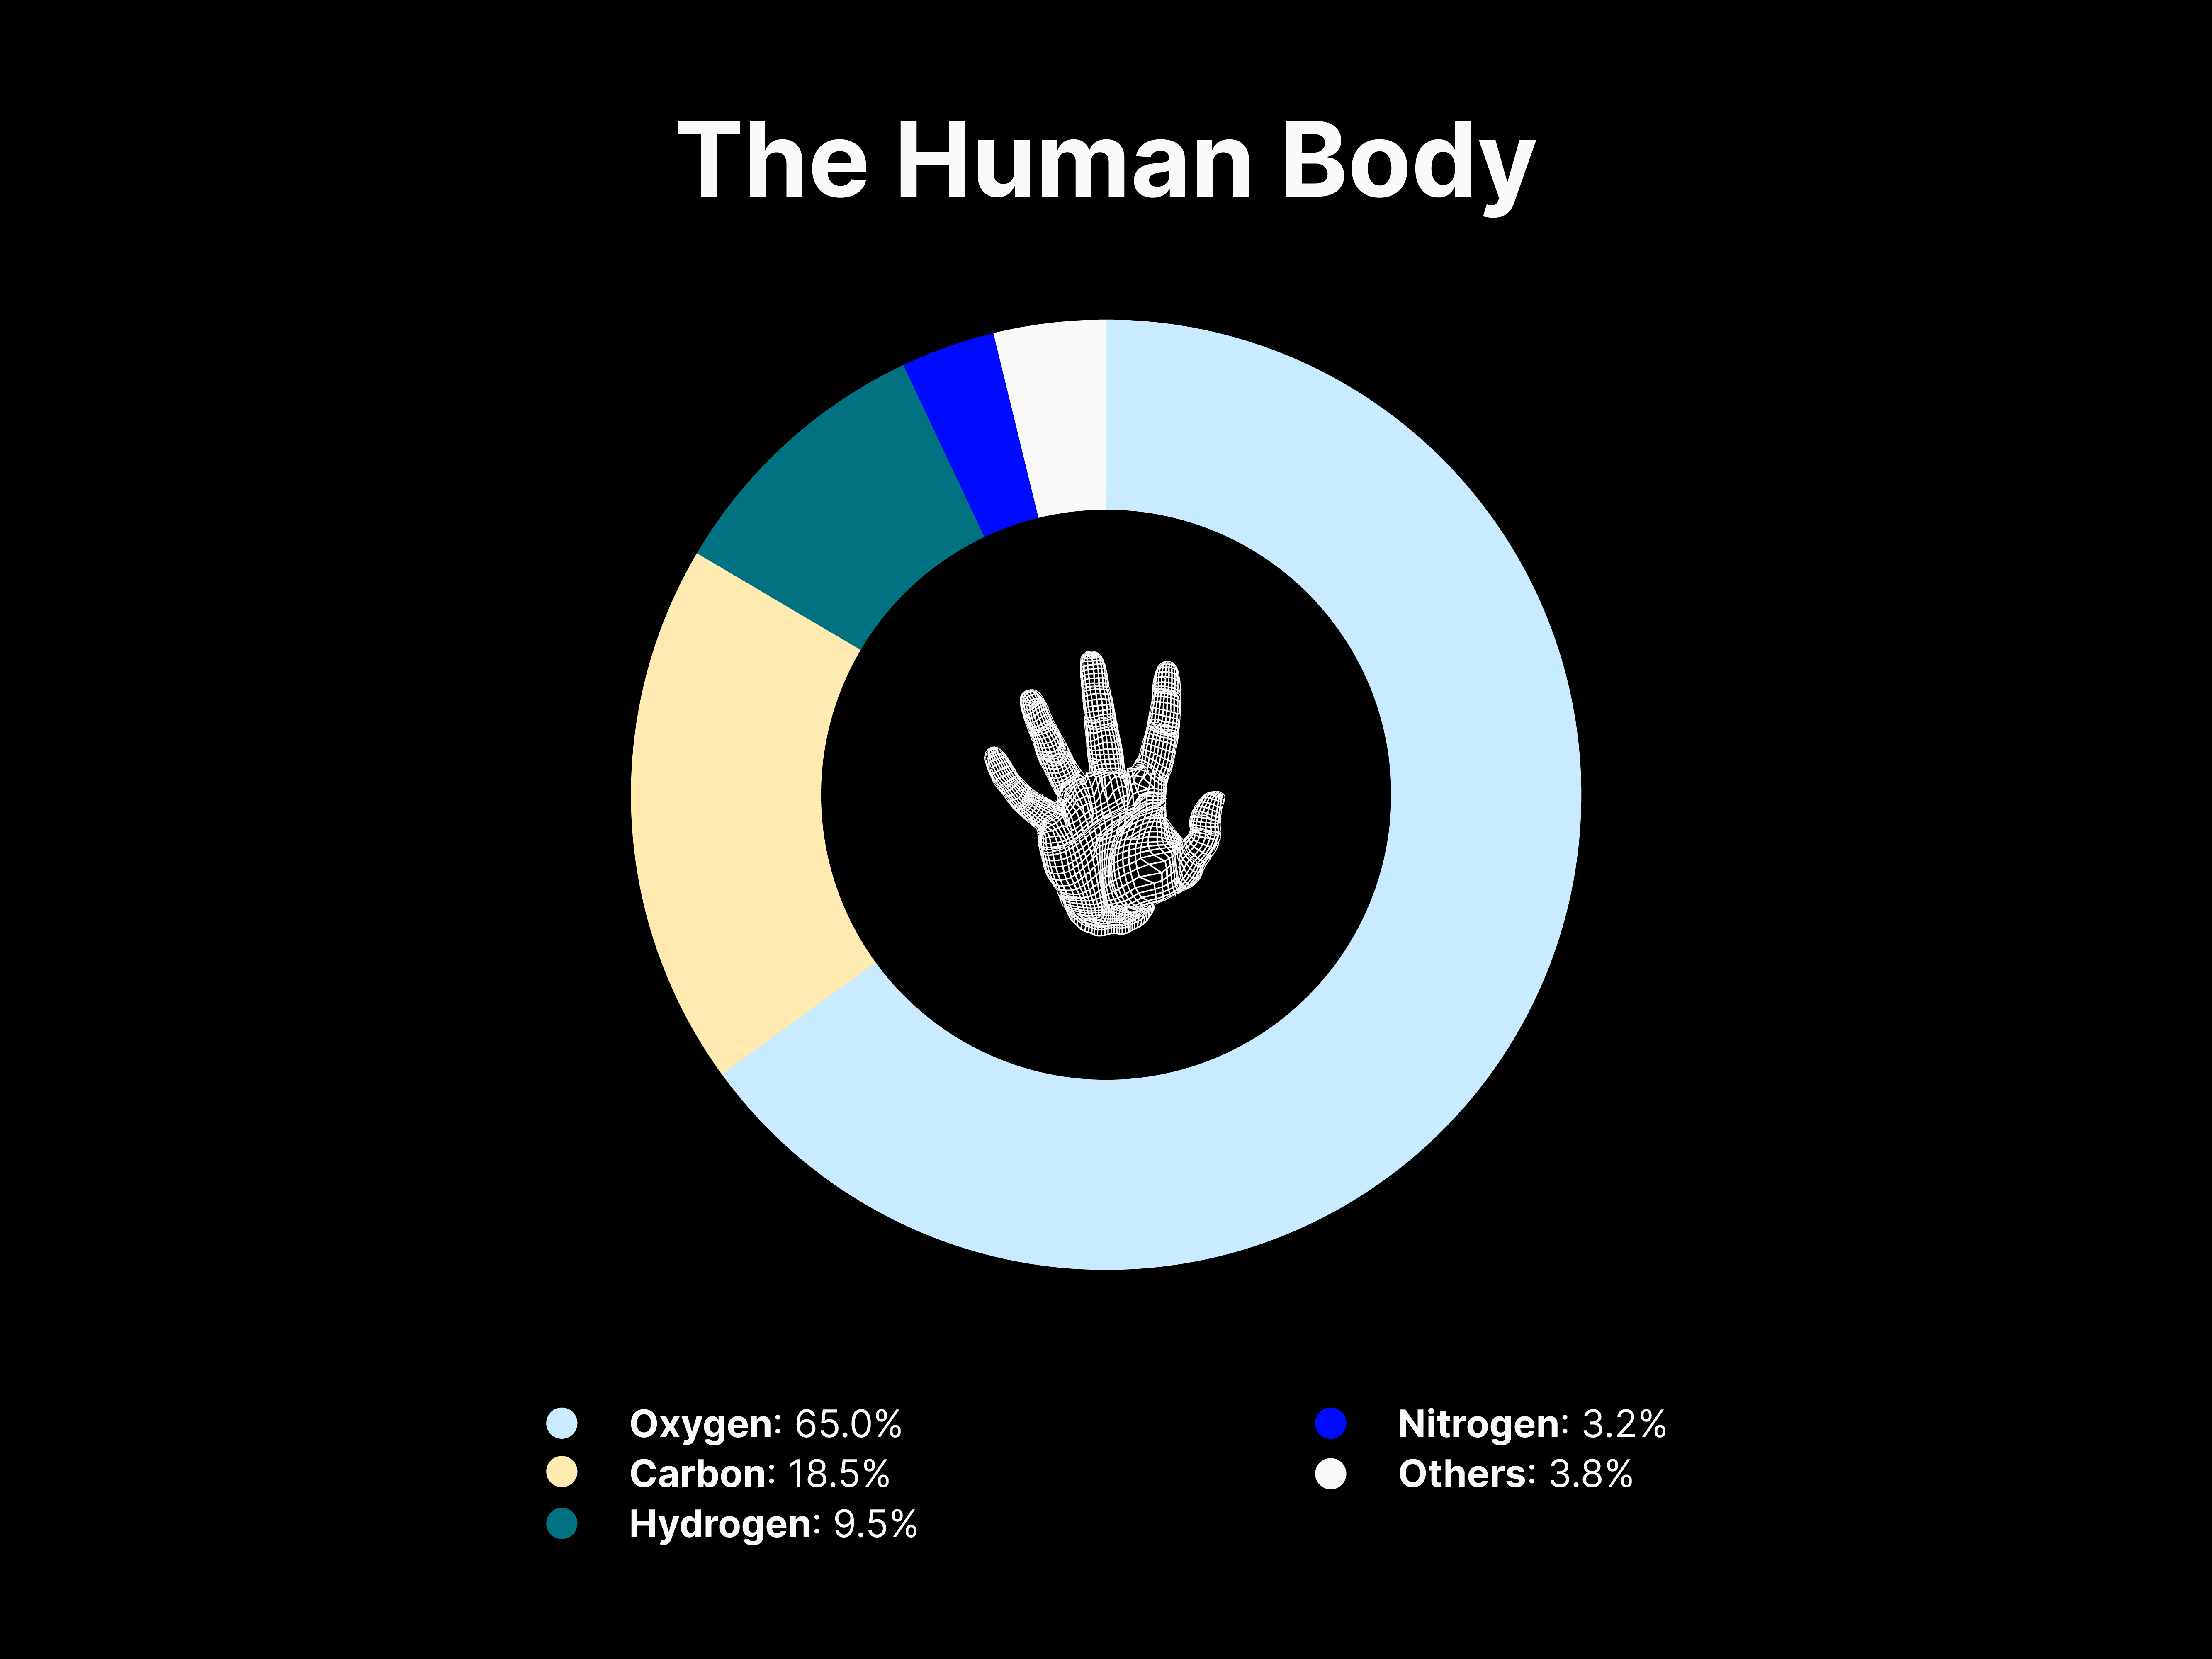
Insights
Apart from isolating the elemental composition in a given environment, the donut graphs provide a drastic representation of how all other elements in the Universe are present in relatively minuscule amounts. As for the human body, the composition appears to widely differ, with Hydrogen, Oxygen, Carbon and Nitrogen accounting for more than 96% of the atoms inside our bodies. This difference can be attributed to how all life on Earth is Carbon-based and the human body is made mostly of water and organic molecules.
These are the elements that are essential to life, yet despite the noticeable difference in composition, the matter that makes us is essentially the same matter that makes up everything around us and the Universe. Quoting Neil deGrasse Tyson, it is a beautiful perspective on how “we are part of this Universe; we are in the Universe, but perhaps more important than both of those facts, is that the Universe is in us.”
Conclusion
When Carl Sagan said that “we’re made of star stuff,” he was not being metaphoric. He was simply noting—in his uniquely precise and poetic way—that the raw materials that constitute our physical bodies were forged in the bellies of distant, long-extinguished stars. These data visualisations of the elements’ fingerprints represented as spectral lines, and their abundance represented as the different graphs gives us a glimpse of what matter is and how it matters.
References
- Bunpei Yorifuji Quote from Wonderful Life with the Elements: The Periodic Table Personified.
https://books.google.com.sg/books?id=yTKKBAAAQBAJ&pg=PA4&lpg#v=onepage&q&f=false - Elements Database (Compiled).
https://docs.google.com/spreadsheets/d/1BoeKwvBt16lDwOOhomtJxVFfoPjRnzKh2uOk1UwzK_A/edit?usp=sharing - Spectral Lines Data.
http://umop.net/spectra/lntbl.php?elem=H&PHPSESSID=cc28408fc3a99e0c792eec20b06fc7b2&sw=3800&lw=7600 - Relative Abundance of Elements in the Universe.
https://www.angelo.edu/faculty/kboudrea/periodic/physical_abundances.htm - Relative Abundance of Elements in the Human Body.
https://askabiologist.asu.edu/content/atoms-life - Neil deGrasse Tyson Quote.
https://www.washingtonpost.com/blogs/blogpost/post/neil-degrasse-tyson-on-the-most-astounding-fact-in-the-universe-video/2012/03/05/gIQAZwv6sR_blog.html - Carl Sagan Quote.
https://www.scientificamerican.com/article/carl-sagans-star-stuff-made-real/#:~:text=When%20Carl%20Sagan%20said%20that,distant%2C%20long%2Dextinguished%20stars.
